Google Search Console keywords are the closest thing you will get to the real list of searches that bring people to your site. Not estimates from a third-party tool, not modelled volumes. Actual queries, with actual impressions and clicks. The problem is that most teams open the Performance report, sort by clicks, read the top twenty rows and close the tab.
This guide is the process we use to get the whole picture out: where the data lives, the limits that hide most of it, the regex filters that do the heavy lifting, and what to do with the list once you have it.
Where to find Google Search Console keywords
In Search Console, open Performance, then Search results, then the Queries tab under the chart. Tick all four metric boxes at the top (clicks, impressions, CTR, average position) so the table shows every column. Set the date range to the last 3 months to start. Shorter ranges hide the long tail, and longer ranges blur recent changes.
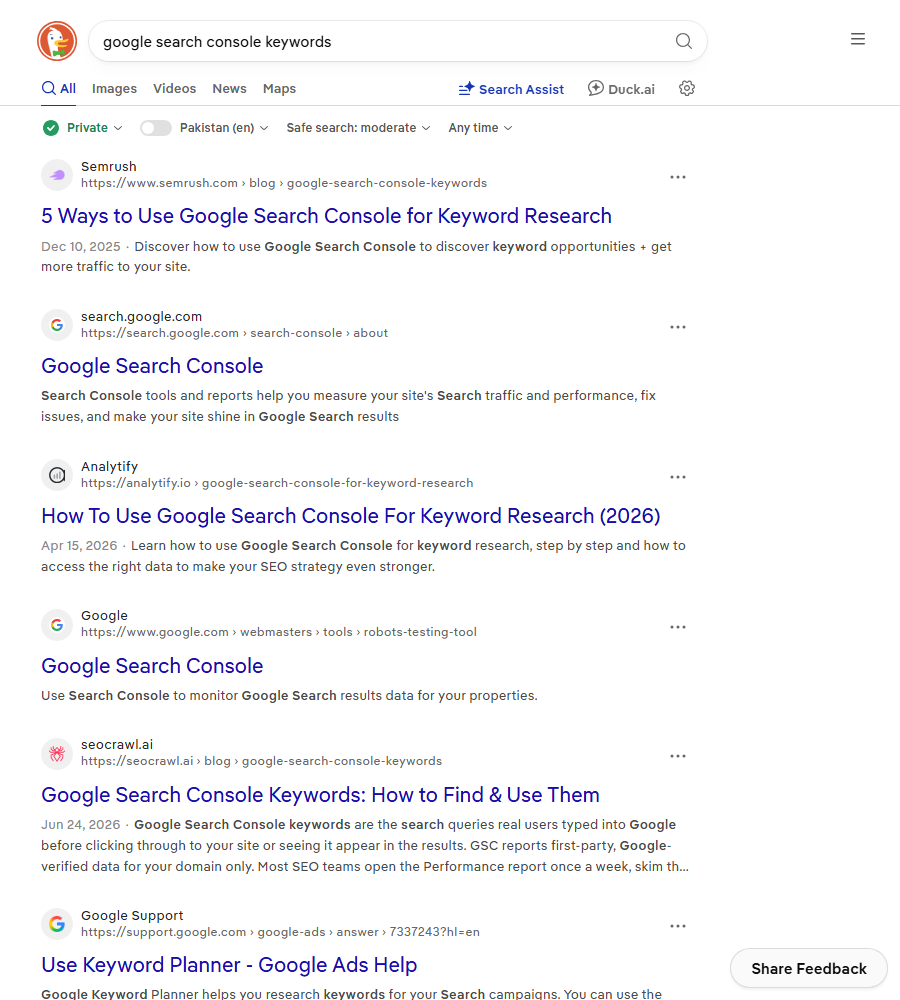
Search the phrase itself and most of the results page is tool vendors explaining this same Queries tab, which tells you how many people get stuck at exactly this step.
The limits that hide most of your data
Before you draw any conclusion from your Google Search Console keywords, know what the Queries table leaves out. These four limits explain almost every “why does Search Console show fewer keywords than Ahrefs” question we get.
| Limit | What it means in practice | How to get around it |
|---|---|---|
| 1,000 rows in the interface and export | A site with 6,000 ranking queries shows you the top 1,000 by clicks | Filter into smaller slices, or use the API |
| Anonymized queries | Rare queries are dropped for privacy, so row totals never add up to the chart total | None. Accept a gap, often large on young sites |
| 16 months of history | Older data is deleted, not archived | Export monthly, or set up the BigQuery bulk export |
| Recent days are incomplete | The last day or two keep changing after you first see them | Compare full weeks that ended at least 3 days ago |
The first row matters most for SaaS sites with a blog. Once you pass a few hundred posts, the 1,000-row cap means the Queries tab only shows your winners. The terms sitting at position 25 with 40 impressions, which are exactly the ones worth working on, fall off the bottom.
Seven regex filters for Google Search Console keywords
The fix for the row cap is to slice the data before you look at it. Click + Add filter, choose Query, then Custom (regex). Search Console uses RE2 syntax, so standard patterns work. These are the seven we paste in first on every audit. That same regex filter is how we build the non-brand row in our monthly SEO analytics report.
- Questions:
^(how|what|why|when|where|which|can|does|is|should)\bfinds informational queries that suit guides and FAQ sections. - Comparisons:
\b(vs|versus|alternative|alternatives|compare|competitor)\bfinds bottom-of-funnel terms for comparison and alternatives pages. - Buying signals:
\b(pricing|price|cost|free|trial|demo|best|top|review)\bshows which commercial terms already find you. - Long tail:
^(\S+\s){4,}\S+$keeps queries of five words or more. These convert well and are usually easy to win. - Non-brand: choose Doesn’t match regex with
yourbrand|your brand|yourbrand\.com, including common misspellings. - Integrations:
\b(integration|integrate|connect|plugin|api|zapier)\bfinds demand for integration pages. - Problems:
\b(not working|error|fix|issue|problem|slow)\bsurfaces support-style searches that often come from existing users.
Each slice gets its own 1,000 rows, so seven filters can show you several thousand distinct Google Search Console keywords that the unfiltered table was hiding. Export each slice to a sheet and give it a tab.
A worked example: 90 days of queries for a payroll SaaS
Paywell is a fictional payroll product with 140 blog posts and about 3,800 ranking queries. Here are eight rows from its question and comparison slices, with the action we would take on each.
| Query | Clicks | Impressions | CTR | Position | Action |
|---|---|---|---|---|---|
| how to run payroll for 2 employees | 41 | 2,310 | 1.8 percent | 7.4 | Rewrite title and intro, answer in first 80 words |
| paywell vs gusto | 12 | 180 | 6.7 percent | 9.1 | Build a dedicated comparison page |
| gusto alternatives for small business | 3 | 940 | 0.3 percent | 18.6 | Add to the alternatives page and link to it from 3 posts |
| what is a payroll register | 88 | 4,120 | 2.1 percent | 4.2 | Leave it, add a link to the payroll register template |
| payroll software with quickbooks integration | 0 | 610 | 0 percent | 31.0 | No page matches, create an integration page |
| how to fix payroll tax error notice | 5 | 420 | 1.2 percent | 11.3 | Pass to support, turn the answer into a help article |
| payroll cost for small business per employee | 9 | 1,560 | 0.6 percent | 14.8 | Add a cost table and a worked example to the pricing guide |
| best payroll app for contractors | 2 | 1,090 | 0.2 percent | 22.4 | Wrong page is ranking, fix internal links and the target page |
Two patterns show up in these Google Search Console keywords that we see on most SaaS sites. Rows with position between 8 and 25 and high impressions are the best opportunities, because a small improvement moves them onto page one. Rows with zero or near-zero clicks at position 30 usually mean there is no page built for that intent, and no amount of on-page tweaking fixes a missing page.
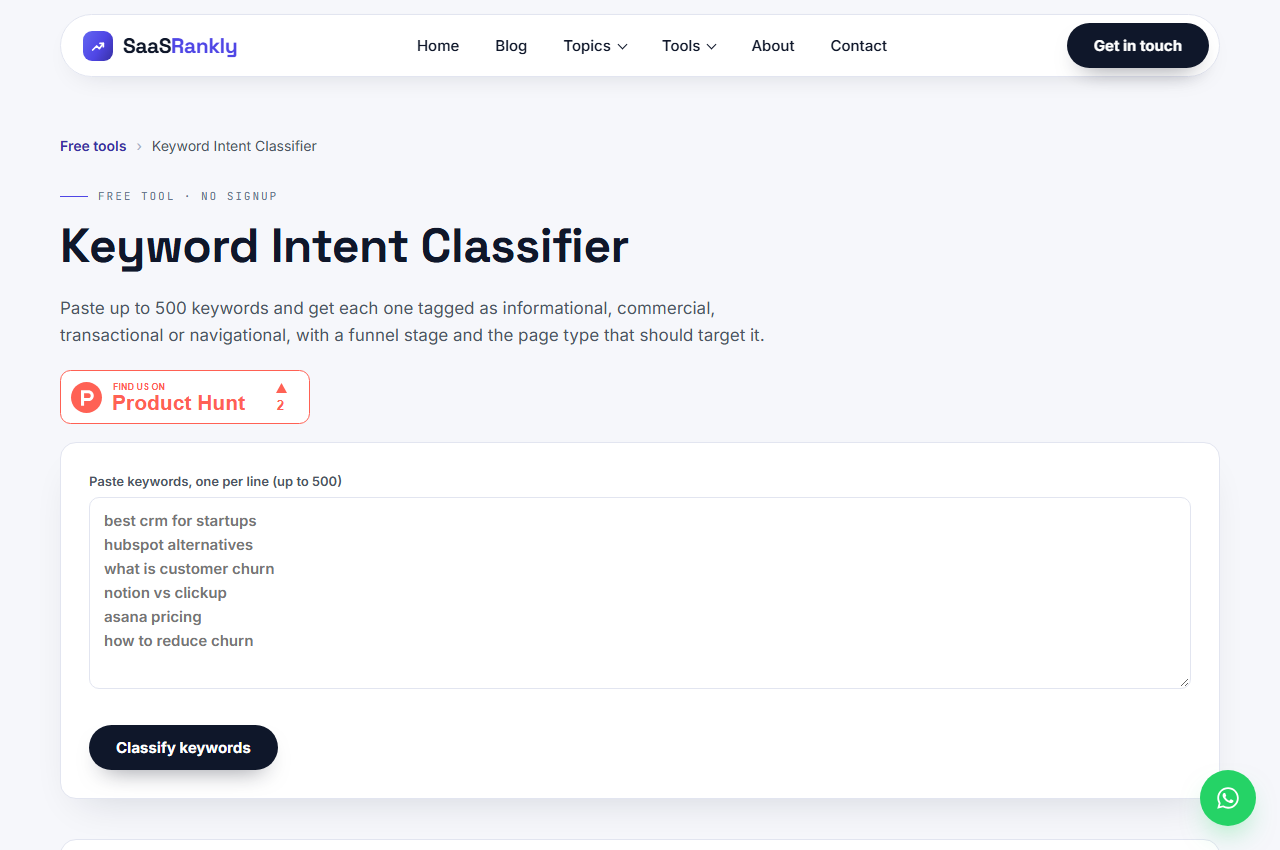
To tag intent across a few hundred rows quickly, paste the exported query column into our free keyword intent classifier. It labels each query as informational, commercial, transactional or navigational and suggests the page type.
Once each query has an intent, match it to one URL. If two of your pages both collect impressions for the same query, you have a cannibalisation problem, and our guide to primary and secondary keywords covers how to split them.
Getting more than 1,000 rows: API and BigQuery
When filters are not enough to see all your Google Search Console keywords, go around the interface. The Search Analytics API is free and returns far more rows per request than the report screen.
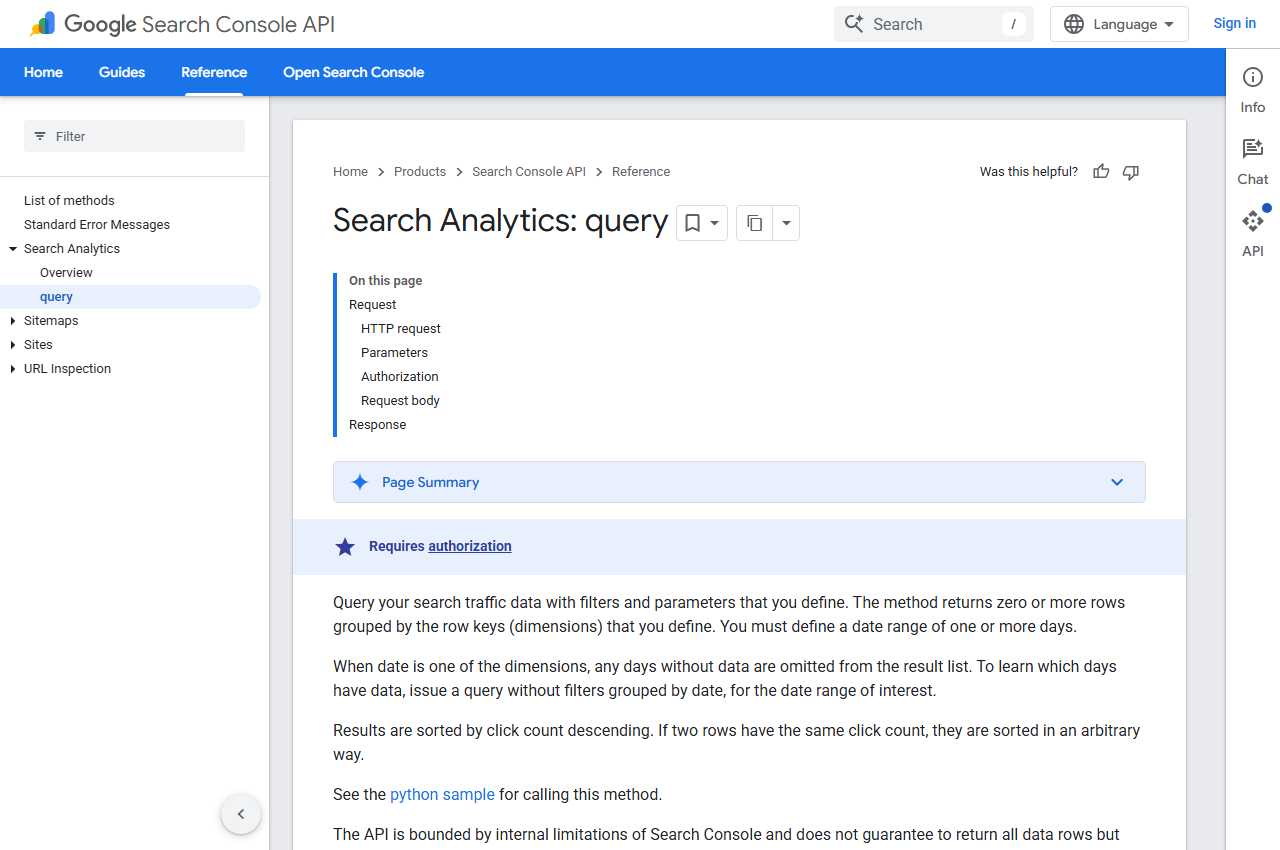
According to Google’s API reference, a request can return up to 25,000 rows and you page through the rest with startRow. You do not need to write code for this. Several free Google Sheets add-ons and the Looker Studio connector call the same API behind the scenes. For a site with a few thousand queries, a monthly pull into a sheet is plenty.
For larger sites, the bulk data export sends Search Console data to BigQuery every day.
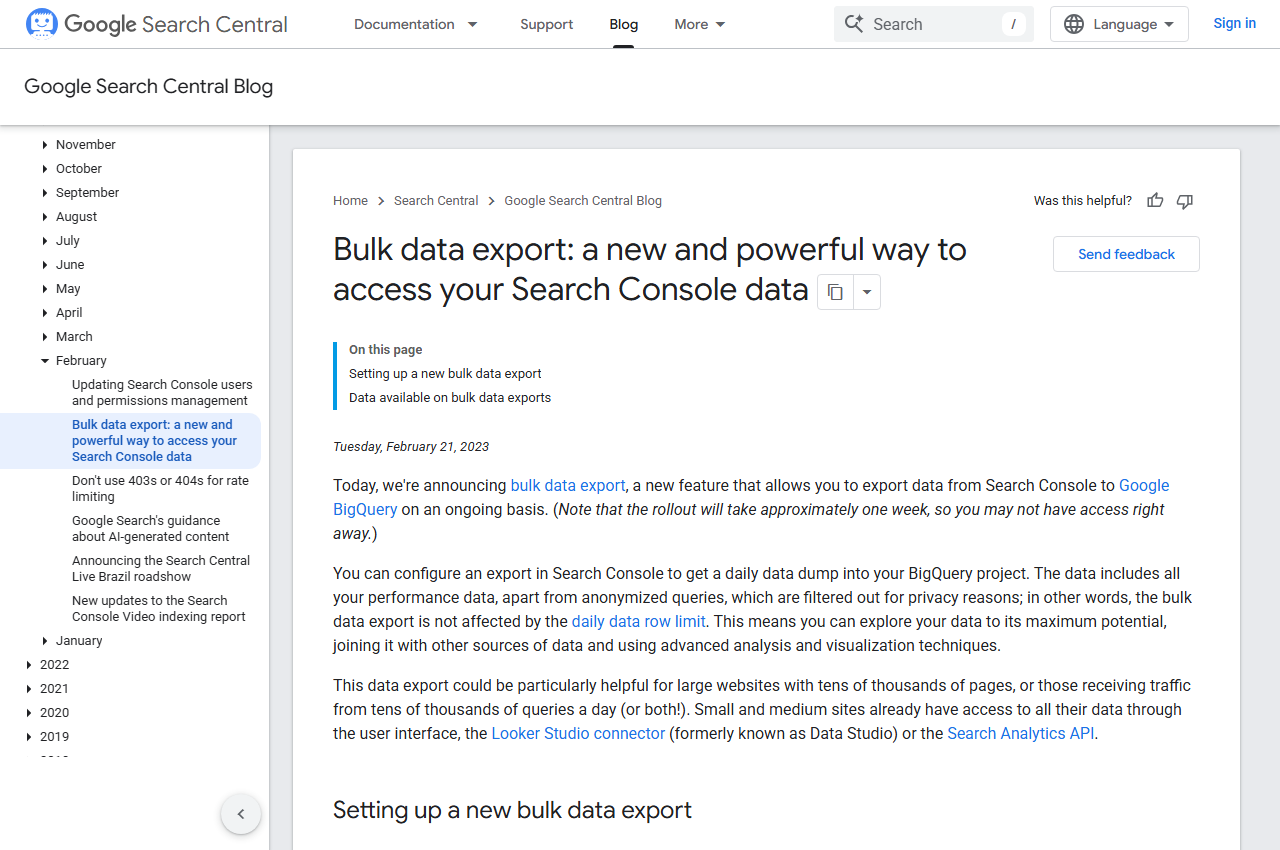
We only recommend the BigQuery export once a site has tens of thousands of pages or queries. It is powerful but needs someone who can write SQL, and BigQuery storage is billed once you pass the free tier. For most SaaS teams under that size, the API plus a spreadsheet does the job.
How to read the numbers without fooling yourself
- Average position is a weighted average, not a rank. A query that shows at position 3 on mobile and 40 on desktop reports something in between that matches neither. Read it per query and per device, never as one sitewide number. Mueller has said the old position scale is hard to map, and we covered what that means for your data.
- CTR depends on the results page layout. A 2 percent CTR at position 4 is poor for a plain results page and normal for one with an AI Overview, a video carousel and four ads.
- Impressions rise before clicks. On a young domain, growing impressions at positions 15 to 40 are the first real sign of progress, often months before clicks move.
- Compare equal periods. Use “compare last 28 days to previous period”, not month against month, so weekday counts match.
If you report Search Console data to a founder or board, pair it with signups from GA4 so the keyword list connects to revenue. Our guide on measuring SaaS SEO with GA4 and Search Console shows that setup, and the SaaS SEO reporting dashboard post shows how to present it on one page.
Monthly Google Search Console keywords checklist
- Export the last 3 months of queries through all seven regex slices.
- Tag intent and assign each query to one target URL.
- Flag queries at positions 8 to 25 with 500 or more impressions as this month’s optimisation list.
- Flag queries at position 30 or worse with no matching page as next quarter’s content ideas.
- Check for two URLs sharing impressions on the same query.
- Save the export somewhere permanent before the 16-month window deletes it.
Quick recap: Google Search Console keywords
- Google Search Console keywords live under Performance, Search results, Queries.
- The interface shows only 1,000 rows, and anonymized queries never appear at all.
- Regex filters split your data into slices, and each slice gets its own 1,000 rows.
- The API returns up to 25,000 rows per request, and BigQuery export removes the row limit for large sites.
- Queries at positions 8 to 25 with high impressions are the fastest wins.
- Read average position per query and device, never as one sitewide number.
FAQ
How do I see all keywords in Google Search Console?
You cannot see every query in the interface, because it caps the table at 1,000 rows and removes anonymized queries. Use regex filters to split the data into smaller groups, or pull it through the Search Analytics API, which returns up to 25,000 rows per request.
Why does Search Console show fewer keywords than Ahrefs or Semrush?
Search Console only lists queries where your site actually appeared, minus anonymized ones, and the table stops at 1,000 rows. Third-party tools estimate rankings from their own keyword database, including terms you rank for too low to get real impressions. The two lists answer different questions.
Can I use Google Search Console for keyword research?
Yes, for existing content. Google Search Console keywords are the best source for queries you already rank for, especially positions 8 to 25. It will not show terms you do not rank for at all, so pair it with a keyword tool when planning new topics.
What is a good CTR in Google Search Console?
There is no single good number because CTR depends on position and on what else is on the results page. Compare each query against your own queries at similar positions. A query well below that average usually needs a better title or a closer match to intent.
How far back does Search Console keyword data go?
Sixteen months. Anything older is deleted. Export monthly to a spreadsheet, or set up the BigQuery bulk export if you need a longer history.
Why are some Search Console queries missing?
Google removes queries made by very few people to protect privacy. These anonymized queries count toward the totals in the chart but never appear as rows, which is why the rows never add up to the headline number.