Most seo analytics reports are too long to be read and too shallow to be useful. Thirty widgets, four tools stitched together, and not one sentence that tells the reader what to do differently next month. We have seen founders open the same 14-page deck every month and skim it in 40 seconds, which is a fair response to a document that answers no question. This post shows the five rows we think belong on a single page, the rows we cut, and how to build each one.
SEO Analytics Reports: Start With the Page, Then Work Backwards
Here is the whole thing. One page, five rows, illustrative numbers for a fictional B2B SaaS called Northlane.
| Row | This month | Last month | 90 days ago | Read as |
|---|---|---|---|---|
| Non-brand organic clicks | 4,120 | 3,780 | 2,940 | Demand you earned, not demand you already had |
| Tracked terms in positions 1 to 10 | 22 of 60 | 18 of 60 | 11 of 60 | Leading indicator, moves before traffic does |
| Organic signups | 96 | 81 | 63 | The only row sales cares about |
| Indexed pages vs published | 184 of 201 | 171 of 196 | 140 of 188 | Silent failures live here |
| Pages in positions 8 to 25 | 31 | 28 | 19 | Next month work queue, already written |
Five rows, three time columns, one sentence of interpretation each. That is the whole of it. Most seo analytics reports are twenty times longer and carry less information. Everything else in this post is about how to fill those cells honestly and what to do when a number moves.
Why Most SEO Analytics Reports Fail
The failures are boringly consistent, and none of them are about tooling. For the plain definition and a one-page example, see what is an SEO report.
Brand traffic is left in. If your company gets written up on a podcast, brand searches spike and the report shows a great month for SEO. It was not a great month for SEO. Split brand from non-brand in every seo analytics report you produce, or the number means nothing.
The report has no decision attached. A chart that goes up and a chart that goes down produce the same meeting if nobody wrote down what either one implies. Each row needs an owner and a trigger.
Averages hide the story. Average position across 4,000 queries is one of the least useful numbers in search. It moves when you gain impressions on terrible terms. Track position for a fixed set of terms you chose deliberately.
Too many tools, no reconciliation. Search Console clicks and GA4 organic sessions will never match, because they count different things at different moments. Pick one as the headline and note the other as context. Our longer explanation of the gap is in measuring SaaS SEO with GA4 and Search Console.
Building Each Row of Your SEO Analytics Reports
Row 1: non-brand organic clicks
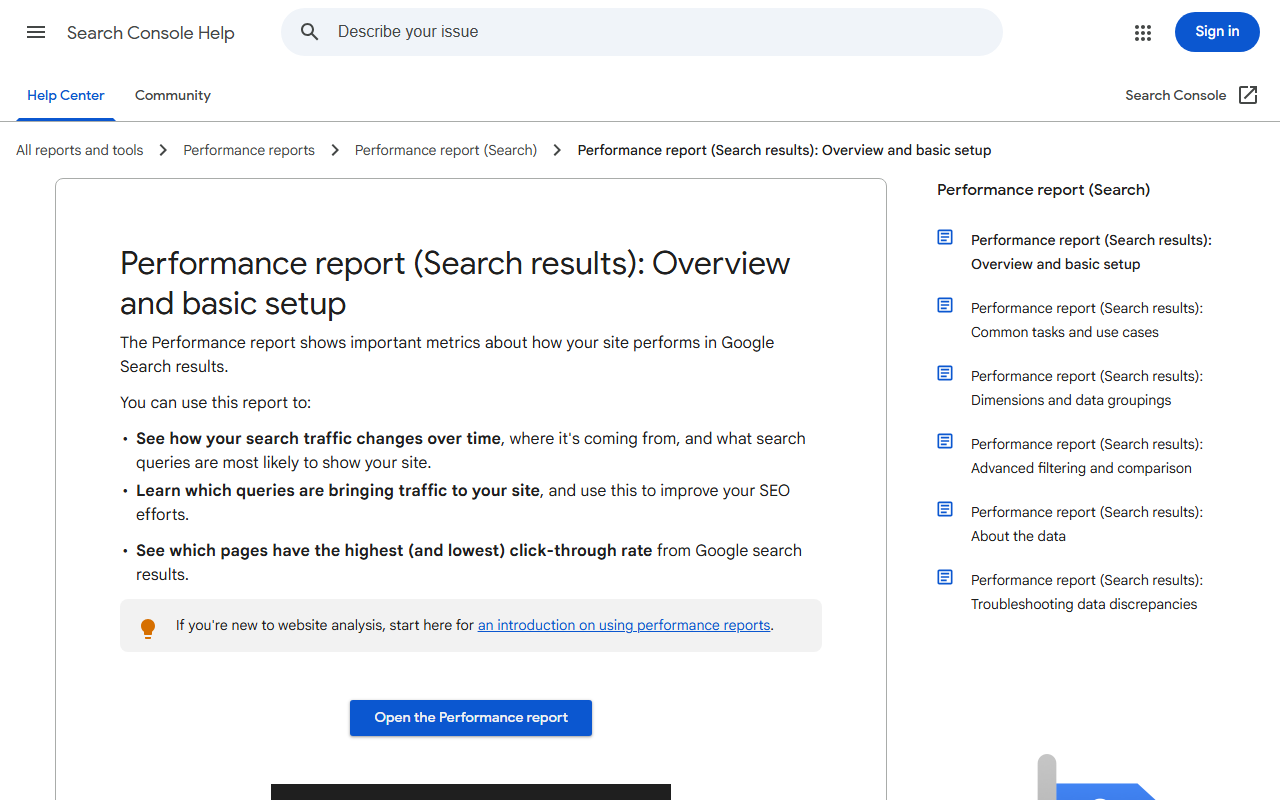
In Search Console, open Performance, add a Query filter set to “Custom (regex)”, choose “Doesn’t match” and enter a pattern covering your brand and its common misspellings. Something like northlane|north lane|norhtlane works. Save that as a bookmark, because you will run it every month. Export the number, not a screenshot of the chart. The filter options are documented in Google Performance report help if the regex option is not showing for you.
Row 2: tracked terms in the top ten
Pick 60 terms once, in a spreadsheet, and do not change the list for at least two quarters. The temptation to swap in terms you are winning is strong and it destroys the only comparison the row offers. Any rank tracker will do this. We compared the options in our rank tracker comparison, and for a 60-term list at the time of writing you are looking at roughly $20 to $40 a month.
Row 3: organic signups
In GA4, build an exploration with Session default channel group set to Organic Search, and your signup conversion as the metric. The honest version of this row includes a note about attribution model, because last-click will undercount organic badly on a 90-day sales cycle. If you have a CRM, take the number from there instead and treat GA4 as a sanity check. Our SEO ROI post goes through the modelling when the cycle is long.
Row 4: indexed pages against published pages
Published count comes from your CMS. Indexed count comes from the Search Console Pages report, the “Indexed” total specifically, not a site: query, which is an estimate and drifts. When the gap widens month over month, something in your template or internal linking broke. This is the row that catches the problems nobody reports.
Row 5: pages sitting in positions 8 to 25
Filter Search Console Performance by page, sort by position, and pull everything between 8 and 25 with more than 50 impressions. These pages already rank. They need a better title, a tighter intro, two internal links, or a section answering the question the current page skips. This is the cheapest work available in any month, and it belongs in the report because it turns the report into a work queue. The extraction method is in getting keyword data out of Search Console.
What We Cut From SEO Analytics Reports
- Domain authority or domain rating. A third-party score that Google does not use. It creates arguments and informs nothing.
- Bounce rate. Redefined in GA4, misread by almost everyone, and meaningless on a documentation page where a fast answer is a success.
- Total backlinks. The count goes up when a scraper copies your footer. Referring domains to specific money pages is the number worth watching, and even that belongs in a quarterly review rather than a monthly report.
- Average position sitewide. Covered above. It moves for the wrong reasons.
- Keyword density and content scores. Production QA, not a reporting metric.
- Traffic forecasts. Nobody believes them, including the person who made them.
Cutting these is not about minimalism for its own sake. Every row you keep is a row someone has to explain when it moves, and explanation time is finite.
Matching SEO Analytics Reports to the Reader
The same five rows serve different audiences with different framing. One page, three covers.
| Reader | Leads with | Cadence | Wants to hear |
|---|---|---|---|
| Founder or CEO | Organic signups and modelled pipeline | Monthly | Is this channel paying for itself yet |
| Head of marketing | Non-brand clicks plus the 8 to 25 queue | Monthly | What are we shipping next and why |
| Engineering or platform | Indexed vs published | Only when the gap widens | A specific bug with a URL attached |
| Board | 90-day trend on signups | Quarterly | Direction, not detail |
Notice the engineering row. Do not send engineers a monthly report. Send them one number when it breaks, with example URLs and a reproduction. That is how indexing bugs get fixed instead of filed.
Cadence for SEO Analytics Reports, and When to Stop
Monthly for the full page, weekly for nothing, quarterly for the strategic review. Weekly seo analytics reports sound diligent and deliver noise on any site smaller than an enterprise, because search data has enough week-to-week variance to make any seven-day comparison meaningless. The exception is a migration or a major template change, where you watch the indexed count daily for two weeks and then go back to normal.
There is also a point where the report should shrink rather than grow. Once a row has been flat and healthy for six months, move it to an alert. Indexed-versus-published is a good candidate: set a threshold, get an email when the gap crosses it, and stop printing the number. The dashboards we build now tend to lose rows over time rather than gain them, and the templates behind ours are in the SaaS SEO reporting dashboard post and, for bigger teams, the enterprise SEO dashboard piece.
A Worked Month: Reading the Report Above
Take Northlane’s numbers and read them the way we would in a real meeting.
Non-brand clicks are up 9 percent, which is fine but not the story. Tracked terms in the top ten went from 18 to 22, a 22 percent jump, and that is the story, because position gains lead click gains by roughly a month on a site this size. Organic signups up 18 percent against clicks up 9 percent means conversion rate improved, so something on the page side worked, probably the three comparison pages that shipped in week two.
Then the row that spoils the mood. Published went from 196 to 201, indexed went from 171 to 184. That looks good until you notice 17 pages are still unindexed and five of them are new. Worth an hour of investigation, not a panic. And 31 pages sitting between position 8 and 25 is the next month of work already identified, which means the content calendar writes itself.
That is four decisions out of five rows, which is the bar seo analytics reports should clear. A 14-page deck routinely produces zero, which is the whole argument. If you want the free checkers we use for the technical half of this, they live on the SaaS Rankly tools page.
Quick recap: seo analytics reports
- Five rows on one page beats thirty widgets nobody reads.
- Always split brand from non-brand, or the headline number lies to you.
- Track a fixed set of terms and refuse to edit the list mid-quarter.
- Indexed against published is the row that catches silent failures.
- Positions 8 to 25 turn the report into next month work queue.
- Good seo analytics reports shrink over time as healthy rows become alerts.
FAQ
What should seo analytics reports include at minimum?
Non-brand organic clicks, position for a fixed keyword set, one conversion metric, and indexed pages against published pages. If you only have 20 minutes a month, those four cover the health of the programme and will surface most problems before they become expensive.
How often should I send an SEO report?
Monthly for the standard page and quarterly for the strategic review. Weekly reporting produces noise on anything smaller than an enterprise site, because normal variance in search data will look like a trend over seven days.
Should seo analytics reports use GA4 or Search Console numbers?
Search Console for anything about search itself, meaning impressions, clicks, queries and positions. GA4 for what happens after the click, meaning sessions, engagement and conversions. They will disagree on volume and that is expected, so pick one for the headline and be consistent about it.
How do I separate brand from non-brand traffic?
Use the regex query filter in the Search Console Performance report with “Doesn’t match” and a pattern covering your brand name plus common misspellings and any product names customers use as shorthand. Save the filtered view and reuse it each month so the definition never drifts.
Is average position a useful metric?
Sitewide average position is close to useless because it shifts when you pick up impressions on irrelevant queries. Average position for one page against one query is genuinely useful and is what belongs in a report.
Can I automate the whole report?
You can automate the data pull with the Search Console API and a Looker Studio connector, and you should. The interpretation sentence under each row is the part that must stay human, and it is also the part that makes anyone read the thing.