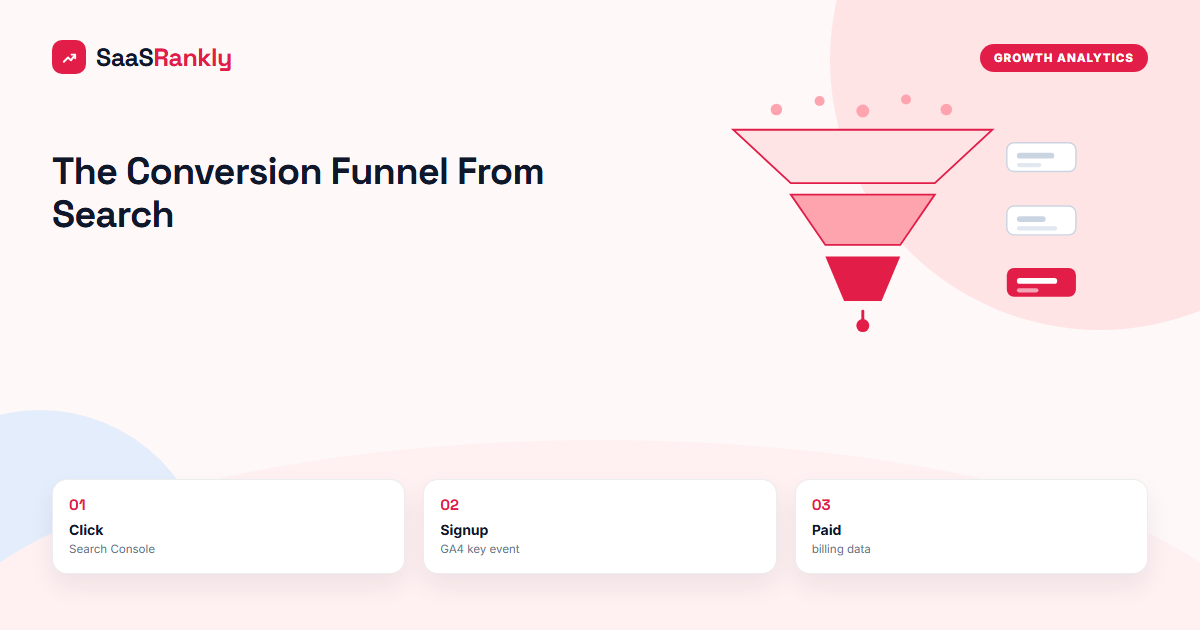
A conversion funnel is the set of steps a visitor takes between first arriving and doing the thing you want, with a count at each step so you can see where people drop out. For a SaaS company the usual version runs from an organic click to a landing page view, a signup or trial start, activation, and a paid account. The concept is old. What changes with SaaS is that half the funnel happens inside the product, where marketing tools cannot see.
We map the conversion funnel for most SaaS sites we take on, usually in the first two weeks, because it decides what the SEO work is supposed to fix. Sometimes the answer is more traffic. More often it is a leak at one step that no amount of new content will fill. Below is how we map one, the rates we treat as normal, a worked example, and the leaks we find most.
The five stages of a SaaS conversion funnel from search
Funnel diagrams online often stop at “awareness, interest, decision, action”. That is fine for a slide and useless for measurement, because none of those stages has an event you can count. Ours uses five stages, each tied to one event that exists in analytics or the product database.
- Organic click. Counted in Search Console. This is the top of the funnel for search, not impressions.
- Engaged landing session. A GA4 session on the landing page that lasts 10+ seconds or views a second page. It filters out bounces from mismatched intent.
- Signup or trial start. The account creation event, or the demo form submission on a sales-led product.
- Activation. The first real use of the product, defined per product: a first project created, a first integration connected, a first invoice sent.
- Paid account. The first payment, counted from billing, attributed back to the first-touch landing page.
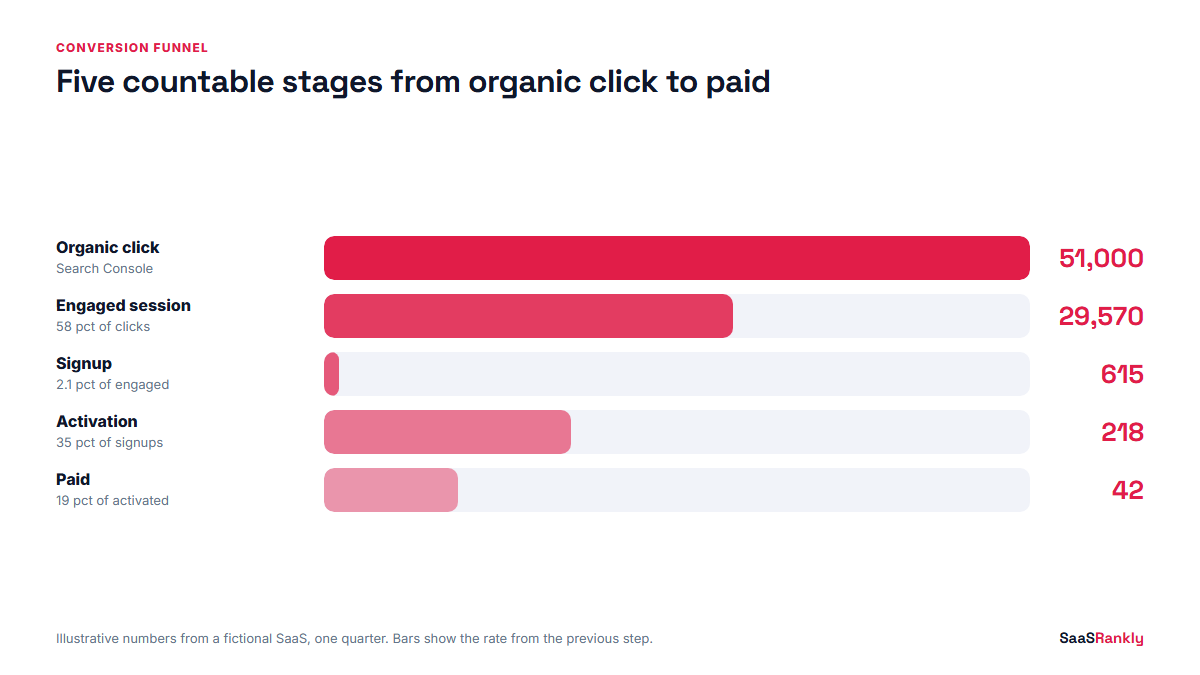
The jump from stage 3 to stage 4 is where most teams lose sight of organic traffic, because the product database does not know which blog post a user first read. Fixing that join is half the value of the exercise. Our guide to measuring SaaS SEO with GA4 and Search Console covers the attribution side.
Conversion funnel benchmarks we treat as normal
Benchmarks are dangerous because every product is different. Still, a team needs to know whether a 0.4 percent signup rate is bad. These are ranges from self-serve and hybrid B2B SaaS sites we have worked on, not industry statistics, and they shift a lot by page type.
| Step | Blog and guide pages | Commercial pages (pricing, alternatives, features) | Red flag below |
|---|---|---|---|
| Click to engaged session | 45 to 65 percent | 55 to 75 percent | 35 percent |
| Engaged session to signup | 0.3 to 1.5 percent | 3 to 9 percent | 0.2 percent (blog), 2 percent (commercial) |
| Signup to activation | 20 to 40 percent | 30 to 55 percent | 15 percent |
| Activation to paid | 10 to 25 percent | 15 to 35 percent | 8 percent |
The gap between the two columns is the main lesson. A blog post converting at 0.8 percent is doing well. A pricing page converting at 0.8 percent has a problem. Blending them into one site-wide conversion rate is how teams end up rewriting the wrong pages.
How we map a conversion funnel in a week
We do not wait for a perfect attribution setup. A rough funnel with real numbers beats an elegant one planned for next quarter.
Day 1 and 2: pull the top two stages
Export clicks by landing page from Search Console for the last 90 days. Pull engaged sessions by landing page from GA4, filtered to the organic search channel. Join them in a sheet on the URL. If you are new to that report, our walkthrough of organic search in Google Analytics 4 shows where the numbers live.
Day 3: add signups
Set the signup event as a key event in GA4 if it is not already, then use a funnel exploration with landing page as the breakdown. Expect the numbers to be lower than your product database shows. Consent banners and ad blockers usually hide 15 to 30 percent of events.
Day 4 and 5: join product data
Ask engineering to store the first-touch landing page and UTM values on the user record at signup. That one field lets you count activation and paid conversion by landing page from then on. For older users you will not have it, and that is fine; start the clock now.
Day 6 and 7: group and read
Group landing pages by type: blog, comparison, alternatives, pricing, integrations, templates. Calculate each step rate per group. The weakest step relative to the benchmark table is the first thing to fix.
A worked example (illustrative)
Here is a fictional invoicing tool, Billwise, priced at $29 a month, with one quarter of organic data. The numbers are invented but realistic for a self-serve product with a content-heavy blog.
| Page group | Organic clicks | Engaged sessions | Signups | Activated | Paid |
|---|---|---|---|---|---|
| Blog guides | 38,000 | 20,900 | 146 | 44 | 7 |
| Invoice templates | 9,500 | 6,200 | 310 | 124 | 22 |
| Alternatives and comparisons | 2,100 | 1,450 | 98 | 21 | 4 |
| Pricing and features | 1,400 | 1,020 | 61 | 29 | 9 |
Three things jump out. Blog guides bring 74 percent of clicks and 17 percent of paid accounts. Templates are the real engine, with a 5 percent signup rate because the visitor can use the product’s core job right on the page. And the alternatives pages have a healthy signup rate but only 21 percent activation, well below the 30 percent floor for commercial pages.
That last one is the leak. People who arrive from “Billwise vs X” pages sign up expecting a feature they cannot find in the first session. The fix is not SEO at all: it is an onboarding path that shows the compared feature first. We have seen that kind of change lift activation on comparison traffic by 10 points within a month.
Myths about the conversion funnel we hear most
Myth: more traffic fixes a weak funnel.
Fact: Doubling clicks into a page that converts at 0.1 percent gives you a second rounding error. Fix the step first, then add traffic.
Myth: the funnel is linear.
Fact: Most SaaS buyers visit three to six times before signing up, often through different pages. A first-touch funnel undercounts blog posts that start research; a last-touch funnel undercounts them even more. Report both, and say which one you are showing.
Myth: top-of-funnel content is a waste.
Fact: Guides rarely convert directly, but they feed internal links, earn backlinks and build the brand searches that convert later. Judge them on assisted signups, not last click. Our post on the B2B content marketing funnel goes deeper on what each content stage should do.
Myth: conversion rate optimisation is a separate team’s job.
Fact: The landing page is where SEO and conversion meet. The same page that ranks has to convert, so the person writing the brief should know the step rates.
The leaks we find most often, as a checklist
- Intent mismatch at stage 2. The page ranks for an informational query but opens with a sales pitch. Engagement under 35 percent is the tell.
- No next step on guides. A 2,500-word post with one call to action in the footer. Add one contextual offer per section that fits the reader’s task.
- Signup forms asking for too much. Each extra required field on a self-serve signup costs us roughly 5 to 10 percent of completions in the tests we have run.
- Activation not defined. If nobody can say what “activated” means for your product, stage 4 cannot be measured and the funnel stops at signup.
- Commercial pages starved of links. Pricing and alternatives pages convert best and often have the fewest internal links. Our guide to high intent keywords for SaaS shows how to find and prioritise them.
- Lower-funnel content missing entirely. If every post targets “what is” queries, the funnel has a wide top and no middle. See our notes on lower funnel marketing for self-serve SaaS for the page types that close that gap.
Quick recap: conversion funnel
- A conversion funnel counts people at each step from first visit to paid account.
- For SaaS from search we use five stages: click, engaged session, signup, activation, paid.
- Step rates differ hugely by page type, so never judge pages on a blended rate.
- Store the first-touch landing page on the user record to connect product data.
- Fix the weakest step against the benchmark before adding traffic.
- Judge guides on assisted signups and commercial pages on direct ones.
FAQ
What is a conversion funnel in marketing?
It is the sequence of steps people go through from first contact with your brand to a purchase or other goal, measured with a count at each step. The drop between steps shows where you lose people.
What are the stages of a SaaS conversion funnel?
We use organic click, engaged landing session, signup or trial start, activation, and paid account. Each stage maps to one event you can count in Search Console, GA4 or your product database.
What is a good conversion rate for a SaaS website?
It depends on page type. Blog pages often convert 0.3 to 1.5 percent of engaged sessions into signups, while pricing and comparison pages convert 3 to 9 percent. A single site-wide average hides that difference.
How do I build a conversion funnel in GA4?
Mark your signup and other key actions as key events, then create a funnel exploration with those steps in order and landing page or session source as a breakdown. Expect some undercounting from consent settings and blockers.
What is the difference between a conversion funnel and a sales funnel?
A sales funnel usually tracks leads through sales stages such as qualified, demo and proposal. A conversion funnel is broader and can track any sequence of actions, including self-serve steps where no salesperson is involved.
How does SEO affect the conversion funnel?
SEO sets the top of the funnel and the intent of the people entering it. Ranking for the right queries improves every later step, because visitors who arrive with a matching problem sign up and activate at higher rates.