Most SEO reports are 14 pages of charts that answer no question. The founder skims to the sessions graph, sees it going up or down, and forms an opinion about SEO based on that single line. This guide replaces the 14 pages with five rows and a Looker Studio dashboard that produces them automatically.
This guide covers saas seo reporting for SaaS teams: what it means, why it matters, and the practical steps to get it right.
The five-row report
| Row | Metric | This period | Change | Why (one sentence) |
|---|---|---|---|---|
| 1 | Organic signups | 312 | up 18 pct | Two new comparison pages started converting |
| 2 | Organic pipeline (CRM) | 41k USD | up 9 pct | Lag from last month signups |
| 3 | Clicks to money pages | 4,120 | up 9 pct | Alternatives pages moved from page 2 to page 1 |
| 4 | Indexed pages / impressions | 214 / 96k | up 12 / up 6 pct | Integration batch 2 indexed |
| 5 | Wins and risks | Won: Notion vs ClickUp page ranking 4. Risk: pricing page LCP 3.1s after redesign, fix in progress | ||
That is the whole report. One number the business cares about at the top, two leading indicators, one health row and one narrative row. The measurement setup guide explains where each number comes from. On a site with thousands of URLs the same five-row idea scales up, and we walked through that version in our enterprise SEO dashboard breakdown.
Rules that keep it readable
- Same five rows every week, same order. Readers learn where to look.
- Every row gets a one-sentence why. A number without a cause is noise.
- Compare 28-day windows, not calendar weeks. B2B traffic drops at weekends and holidays.
- Round aggressively. 4,120 not 4,118. Percentages to whole numbers.
- Put the ask at the bottom: “Need: engineering time to fix LCP on pricing.” Reports that ask for nothing get nothing.
Building the dashboard in Looker Studio
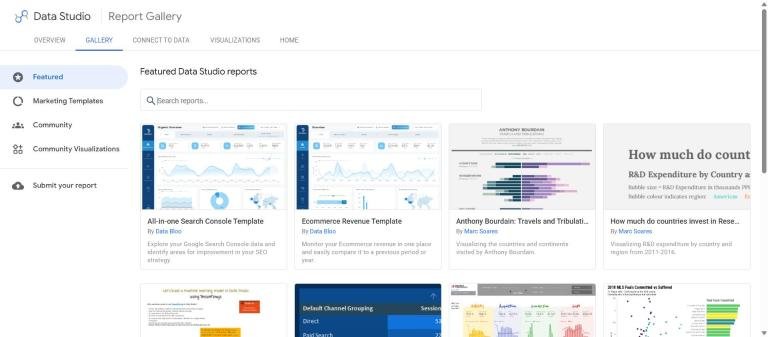
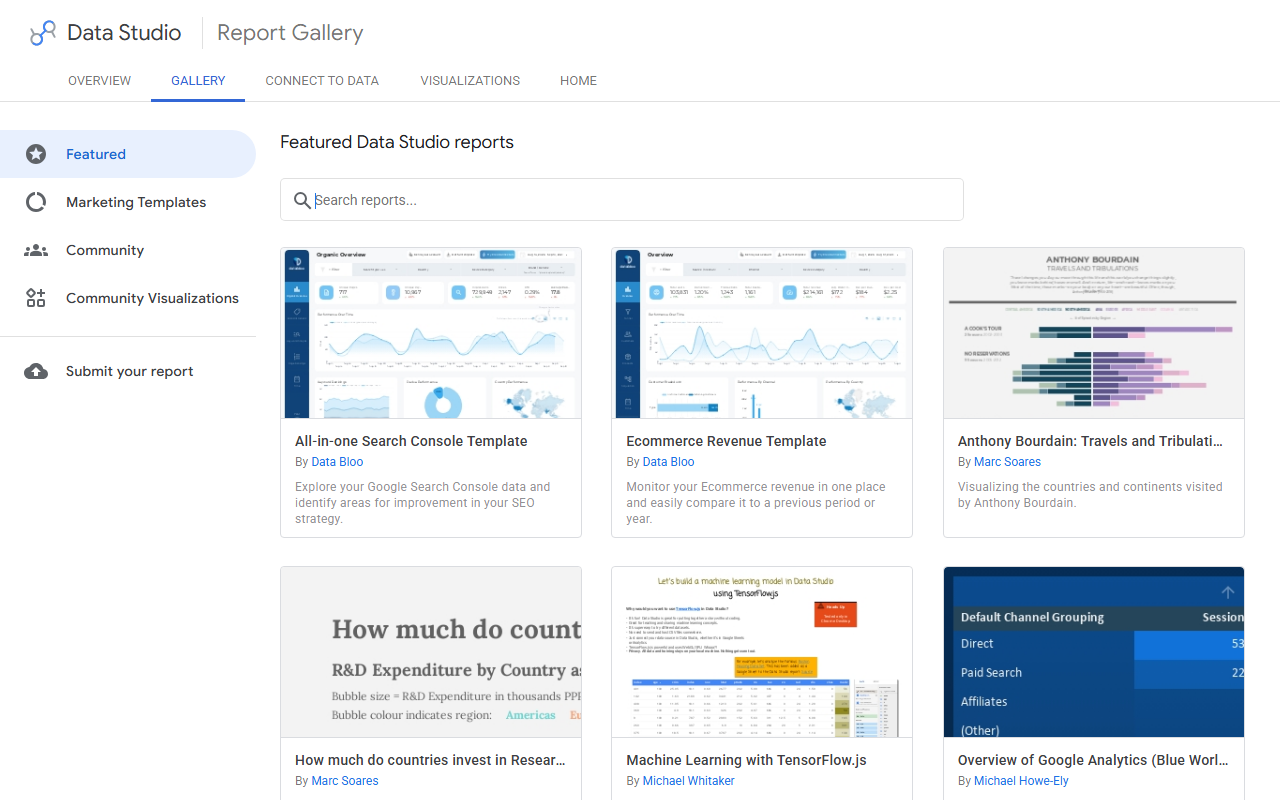
Looker Studio is free and connects natively to Search Console and GA4. The community gallery has ready-made Search Console templates you can copy and repoint at your property in a minute.
Setup in order:
- Add the Search Console connector twice: once at URL level (for page filters) and once at site level (for totals).
- Add the GA4 connector and choose the key event you defined for signups.
- Create a scorecard for organic signups, filtered to the organic search default channel group, with a 28-day comparison.
- Create a scorecard for clicks with a page filter using regex for money page folders:
^/(compare|alternatives|integrations|pricing). - Create a table of landing pages by signups, sorted descending, limited to 10 rows.
- Add a text box for the wins and risks row. This one is manual, on purpose.
- Schedule email delivery every Monday morning to the founder and the team.
What to pull from Search Console each week
Beyond the numbers, open two reports for the narrative row. The page indexing report shows whether new content is being indexed and whether anything dropped out. The performance report filtered to money pages, comparing periods, shows which page moved and in which direction.
The health check that belongs in every report
Run PageSpeed Insights on the pricing page and one money page every week and record the mobile performance score. A design change or a new script can halve the score overnight and rankings follow two weeks later. Catching it in the report is what makes the weekly cadence worth it.
Monthly additions
Once a month, add three rows below the weekly five: referring domains gained to money pages (from Ahrefs Webmaster Tools), keywords in positions 4-10 for money pages (the near-wins to push), and content shipped versus planned. Keep these off the weekly report; they move too slowly to read weekly.
What to leave out
- Total sessions and pageviews. They reward informational content over commercial content.
- Average position across all queries. It falls every time you rank for something new.
- Domain rating or authority scores. Useful for link prospecting, meaningless as an outcome.
- Keyword counts. Ranking for 4,000 keywords means nothing if the ones that convert are not among them.
- Anything you cannot explain in one sentence.
Copy-paste template
SEO update, week of [date]
1. Organic signups: [n] ([change]) - [why]
2. Organic pipeline: [n] ([change]) - [why]
3. Money page clicks: [n] ([change]) - [why]
4. Indexed pages / impressions: [n] / [n] ([change]) - [why]
5. Wins: [one]. Risks: [one]. Need: [one ask].
Frequently asked questions about SaaS SEO reporting
Weekly or monthly?
Weekly for the five rows, monthly for backlinks and content throughput, quarterly for strategy. Weekly keeps SEO visible without needing big numbers.
What if signups are too small to be meaningful weekly?
Report them anyway with the 28-day window, and lean on the leading indicators in rows 3 and 4 for the narrative. Say explicitly that the sample is small.
Should I share rankings?
Only as part of the wins and risks row when a specific page moves. A rankings table invites arguments about individual keywords.
Which dashboard tool is best?
Looker Studio for free native connectors. Paid tools add convenience, not information, at this stage.
Quick recap: Saas seo reporting
Saas seo reporting usually comes down to a short, repeatable checklist. Use this whenever saas seo reporting comes up again:
- Diagnose saas seo reporting by checking the relevant report first, not assumptions.
- Confirm the current setup is actually causing saas seo reporting before you change anything.
- Re-check saas seo reporting again after the fix ships, not before.
Treat saas seo reporting as an ongoing signal rather than a one-time fix. For background on the platform rules behind this, see Google Search Central.