An SEO traffic projection is the number a founder remembers long after they forget the method behind it. We have watched a single slide that said “40,000 visits by month nine” shape a whole year of hiring, and we have watched that same slide get quietly dropped in month four. So this guide is about building an SEO traffic projection that survives contact with real Search Console data: what goes in, which assumptions break first, and how to present a range instead of a promise.
We build these for SaaS sites most weeks. The method below is the one we actually use, with the shortcuts we take and the ones we refuse to take.
What an SEO traffic projection is (and what it is not)
A projection is a model. You take a list of keywords, estimate where you could rank for each one by a certain date, multiply search volume by an expected click-through rate for that position, and add it up. That is the whole idea. Everything else is about making each of those three inputs less wrong.
It is not a traffic estimate of an existing site. If you want to know how much traffic a competitor gets today, that is a different job, and we covered it in our guide on how to estimate website traffic honestly. A projection looks forward. An estimate looks at the present. Mixing them up is the first mistake we see, usually when someone copies a competitor’s estimated traffic and writes it down as their own target.
It is also not a forecast in the statistical sense. With a new SaaS blog you rarely have enough history for time series models to mean anything. You are reasoning from rankings and CTR, not extrapolating a trend line. Once a site has 12 months of clean data, a trend model becomes useful as a second opinion. Before that, it mostly draws confident curves through noise.
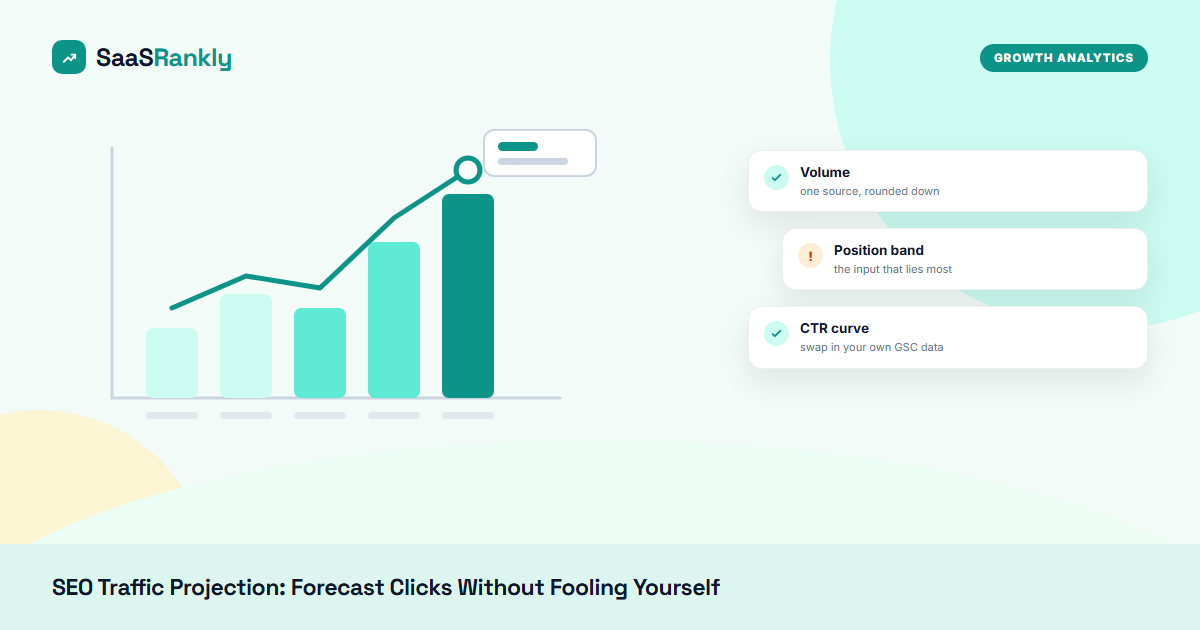
The three inputs, and which one lies the most
| Input | Where it comes from | How wrong it usually is | What we do about it |
|---|---|---|---|
| Search volume | Ahrefs, Semrush, Keyword Planner | Often 30 to 50 percent off in either direction for small terms | Use one tool consistently, round down, never sum volumes across tools |
| Target position | Your judgement plus KD and SERP review | The biggest error by far | Assign a position band, not a number, and discount hard SERPs |
| CTR per position | Public CTR studies and your own Search Console | Varies a lot with SERP features | Replace study CTR with your own as soon as you have 3 months of data |
Volume gets blamed the most, but in our experience the target position is the input that ruins projections. People write “position 3” next to a keyword because the article will be good. Good is not enough when the page one results all belong to domains with ten times your authority. We would rather write “position 8 to 15” and be pleasantly surprised.
How we build an SEO traffic projection, step by step
- Pull the keyword list. Start from the pages you actually plan to publish in the next two quarters, not from every keyword in the niche. One primary keyword per page, plus the two or three variants it will realistically rank for. Our keyword intent classifier helps here, because informational and commercial terms convert so differently that they deserve separate rows.
- Use one volume source. We use Ahrefs US volume for everything in a model. If you blend Ahrefs for some rows and Semrush for others, the total means nothing, since the two tools are calibrated differently.
- Assign a position band per keyword. Look at the actual SERP. If the top five are all big brands and the KD is over 40, our band for a young site is 11 to 20 at month six. If the SERP has forums, thin listicles or outdated posts, a band of 4 to 7 is fair.
- Map each band to a CTR. Use a blended CTR for the band, not the CTR for its best position.
- Add a ramp. New pages do not rank on day one. We assume 0 percent of target traffic in months one and two, 25 percent in month three, 50 percent by month five, and full target by month eight for low-KD terms.
- Build three scenarios. Low, expected and high. Present the range. If a stakeholder insists on one number, give them the expected case and say out loud that it sits inside a range.
That ramp in step five is the part that saves the most arguments later. Nobody is disappointed by a slow month three if month three was always meant to be slow.
CTR curves: use public studies first, then your own
For a brand new site we start from public organic CTR studies. The Advanced Web Ranking CTR study is the one we reach for most, because it breaks CTR down by device and by query type. At the time of writing, its numbers put position one somewhere in the 20 to 30 percent range for non-branded desktop queries, with a steep fall after position three.
Those curves are averages across millions of keywords. Your SERPs are not average. A keyword with an AI Overview, a video carousel and four ads above the first organic result will deliver a fraction of the study CTR. So once you have three months of Search Console data, swap the public curve for your own. Export queries with position and CTR, group them by position band, and take the median. Our post on getting keyword data out of Search Console walks through the export.
Here is the blended band table we use as a default before a site has its own data. These are illustrative working numbers, not a study.
| Position band | Blended CTR we assume | When we cut it in half |
|---|---|---|
| 1 to 3 | 18 percent | AI Overview present, or heavy ads |
| 4 to 7 | 6 percent | Video or shopping carousel above |
| 8 to 10 | 2.5 percent | People Also Ask block with 4+ questions |
| 11 to 20 | 0.8 percent | Almost always, page two gets little |
| 21 and below | 0.1 percent | We usually set it to zero |
A worked example (illustrative)
Say a SaaS company selling scheduling software plans eight articles. The numbers below are invented for this example, but the shape is exactly what we see in real models.
| Keyword | US volume | Band at month 8 | CTR | Monthly clicks |
|---|---|---|---|---|
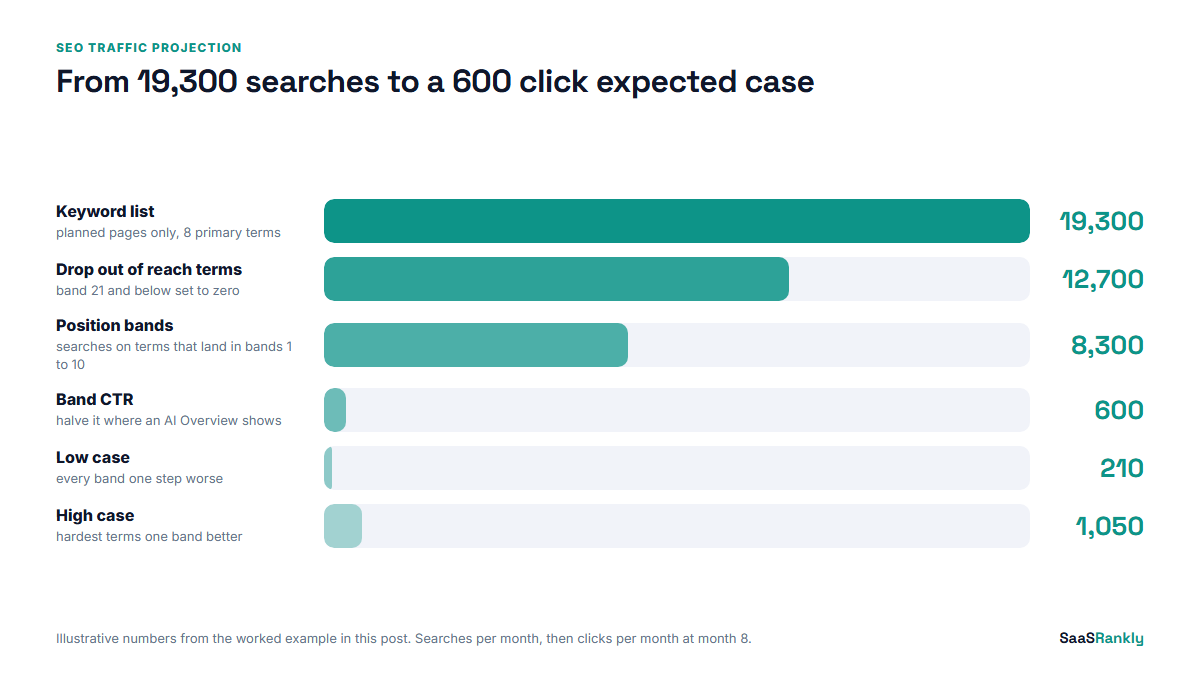
| meeting scheduling software | 4,400 | 11 to 20 | 0.8 percent | 35 |
| how to schedule a meeting across time zones | 1,300 | 4 to 7 | 6 percent | 78 |
| calendly alternatives | 2,900 | 8 to 10 | 2.5 percent | 73 |
| round robin scheduling | 900 | 4 to 7 | 6 percent | 54 |
| meeting request email template | 2,400 | 1 to 3 | 9 percent (halved, AI Overview) | 216 |
| booking page examples | 500 | 1 to 3 | 18 percent | 90 |
| scheduling link etiquette | 300 | 1 to 3 | 18 percent | 54 |
| best free scheduling app | 6,600 | 21 and below | 0 percent | 0 |
| Total | 19,300 | 600 |
Look at what happened. The two biggest keywords, worth 11,000 searches between them, contribute 35 clicks. The smaller, specific queries carry the model. That is normal for a young site, and it is the single most useful thing a projection shows a team: where the realistic traffic will come from. It is the same reason we keep pointing people toward low competition keywords first.
The low scenario for this example drops every band by one step and lands near 210 clicks a month. The high scenario lifts the three hardest terms one band and lands near 1,050. So the honest answer is “roughly 200 to 1,000 clicks a month by month eight, with 600 as the expected case.” That sentence is less exciting than a single number. It is also much harder to be wrong about.
Five mistakes that break a projection
- Summing all keyword variants. One page ranking for “round robin scheduling” and “round robin meeting scheduling” does not get both volumes in full. Volumes overlap. We count the primary keyword at full volume and variants at 30 percent.
- Ignoring the ramp. A model that shows full traffic in month one gets abandoned in month two.
- Using impressions as the goal. Impressions rise long before clicks do. Report them, but do not project them as the outcome. Our piece on what counts as a click explains why the two diverge.
- Forgetting seasonality. B2B search dips in late December and August in most markets. Flat monthly volume hides that.
- Projecting traffic but not revenue. Clicks only matter if some of them become trials. Add a conversion row, even a rough one, and link it to your SEO ROI model.
Turning the SEO traffic projection into something people use
We keep the model in a plain spreadsheet with one tab per scenario and a monthly actuals row pulled from Search Console. Every month we put actual clicks next to projected clicks. When actuals run more than 40 percent below the low case for two months in a row, we revisit the position bands, because that is nearly always where the error lives.
Tools exist that automate parts of this. Ahrefs and Semrush both show “traffic potential” per keyword, which is a decent shortcut for the volume plus variants step. At the time of writing, Ahrefs plans start at $129 a month and Semrush at $139.95 a month, so for a small team the spreadsheet method plus a free SERP metrics review is often enough. We would not pay for a dedicated forecasting tool until you have at least 50 pages and a year of data.
One last habit. Write the assumptions on the first tab, in sentences. “We assume position 4 to 7 for low-KD how-to queries by month six.” When the model is wrong, and parts of it will be, you can see which sentence was wrong and fix that, instead of throwing the whole projection away.
Quick recap: SEO traffic projection
- An SEO traffic projection multiplies volume by expected CTR at a target position, summed across planned pages.
- Target position is the input that fails most often, so use bands and read the actual SERP.
- Start with a public CTR curve, then replace it with your own Search Console medians after three months.
- Add a ramp: little traffic in months one and two, full target around month eight for easy terms.
- Present low, expected and high scenarios, never a single promise.
- Track actuals against the model monthly and fix the assumption that broke, not the whole sheet.
FAQ
How accurate is an SEO traffic projection?
For a young site, we treat anything within 40 percent of the expected case after eight months as a good model. Accuracy improves sharply once you replace public CTR curves with your own Search Console data.
What is a good timeframe for an SEO traffic projection?
Twelve months is the most useful window. Shorter than six months mostly shows the ramp, and longer than eighteen months stacks too many assumptions on each other.
Which tool is best for SEO traffic forecasting?
A spreadsheet with Ahrefs or Semrush volumes and your own CTR data covers most SaaS needs. Dedicated forecasting tools start to pay off once you have a large site and a year or more of history.
Should I project impressions or clicks?
Project clicks, and if you can, trials or signups. Impressions are a useful early signal, but they are not the outcome anyone is paying for.
How do AI Overviews change a traffic projection?
They lower CTR for informational queries where they appear. We halve the CTR for any keyword that currently shows an AI Overview, and we recheck those SERPs every quarter.
Can I build an SEO traffic projection for a brand new domain?
Yes, but use conservative bands, a longer ramp and a wide range between the low and high cases. A new domain has no history, so the model is mostly a planning tool for which pages to write first.