An SEO KPI report has one job: tell a founder, in under two minutes, whether organic search is paying for itself and what happens next. Most of the reports we inherit fail that test. They run to 14 slides, open with a domain rating chart, and bury sign-ups on page nine. This post gives you the one-page SEO KPI report format we use with SaaS founders, the thresholds that decide what colour each row turns, and an illustrative filled-in example you can copy.
If you are still deciding which metrics belong on the page at all, start with our list of SEO KPIs for SaaS. This post assumes you have picked them and need to present them.
The one-page SEO KPI report template
Every row has the same five columns. That consistency is the whole trick: a founder learns to read the layout once and then scans it in seconds every month after.
| Row | This month | vs last month | vs same month last year | Status and next action |
|---|---|---|---|---|
| 1. Trials or demos from organic | count | change | change | one line |
| 2. Organic sign-up rate (sign-ups / organic sessions) | percent | change | change | one line |
| 3. Clicks to money pages (pricing, comparison, alternatives, integrations) | count | change | change | one line |
| 4. Non-branded clicks, whole site | count | change | change | one line |
| 5. Priority keywords in top 3 | x of y | change | n/a | one line |
| 6. Technical health (indexed money pages, Core Web Vitals pass) | pass / fail | change | n/a | one line |
Six rows. Revenue-side rows go first, traffic second, leading indicators third, plumbing last. The order is deliberate. If row 1 is green, the founder can stop reading. If it is red, the rows below explain why.
We also keep the comparison against the same month last year, because SaaS search has strong seasonality. December and August dip for most B2B tools. A 15 percent month-on-month drop in December is normal; a 15 percent drop against last December is not.
Thresholds: when a row turns red
An SEO KPI report without thresholds turns into a debate every month. Agree these once, in writing, and the colours decide themselves. These are the defaults we start with at the time of writing; adjust them after three months of your own data.
| Row | Green | Amber | Red |
|---|---|---|---|
| Organic trials or demos | Up or flat YoY | Down 1 to 15% YoY | Down more than 15% YoY |
| Organic sign-up rate | Above 1.5% | 0.8 to 1.5% | Below 0.8% |
| Clicks to money pages | Up MoM or YoY | Flat | Down on both |
| Non-branded clicks | Up YoY | Down under 10% YoY | Down 10% or more YoY |
| Priority keywords in top 3 | Gained 1 or more | No change | Lost 2 or more |
| Technical health | All money pages indexed, CWV pass | 1 page issue | 2 or more, or a template-wide issue |
The sign-up rate bands are rough. A developer tool with a free tier converts very differently from a $30,000 a year platform with a demo form. Use your own last six months to set the amber band, then leave it alone.
An illustrative SEO KPI report, filled in
Here is what a finished month looks like for a fictional HR software company with around 40,000 organic sessions a month. The numbers are invented to show the format, not taken from a real account.
| Row | September | vs Aug | vs Sep last year | Status and next action |
|---|---|---|---|---|
| Organic demos | 63 | +9% | +31% | Green. Two new alternatives pages drove 14 of them. |
| Organic sign-up rate | 1.1% | -0.2 pts | +0.1 pts | Amber. Blog traffic grew faster than demos; adding demo CTAs to top 10 posts. |
| Clicks to money pages | 4,380 | +12% | +48% | Green. |
| Non-branded clicks | 18,900 | -4% | -11% | Red. AI Overview now answers 6 of our top definition queries; shifting effort to comparison content. |
| Priority keywords in top 3 | 14 of 40 | +2 | n/a | Green. |
| Technical health | Pass | same | n/a | Green. One redirect chain fixed on pricing. |
Notice the red row does not panic anyone, because the rows above it are green. That is the value of putting revenue first. A report that opened with “non-branded clicks down 11 percent” would have triggered a crisis meeting about a problem that is not hurting the business yet.
Also notice how short the action column is. One sentence, one owner, one change. If you cannot write the action in a sentence, you do not know it yet, and the report should say “investigating” rather than invent one.
What we cut from every SEO KPI report
These metrics are not useless. They just do not belong on the one page a founder reads. We move them to a secondary tab or drop them:
- Domain rating or authority score. A third-party estimate that moves slowly and says nothing about revenue.
- Total ranking keywords. It flattens eventually and makes a healthy programme look stalled.
- Average position across the site. Mixing 4,000 queries into one number hides everything interesting.
- Backlinks gained. Useful for the SEO team’s own tracking, meaningless to a CEO without context.
- Bounce rate. GA4 replaced it with engagement rate, and neither tells you much on a single-answer page.
- Pages published. An activity count, not an outcome. It belongs in the content team’s standup.
We go into the wider question of what any SEO report should contain in what an SEO report should include. The KPI report is the narrow, top-of-the-pile version of that.
Building it: tools and time
You do not need a dashboard product. Our setup for most clients:
- Search Console for clicks, money-page clicks and non-branded clicks (filter out brand terms with a regex on the query).
- GA4 or your product analytics for organic sign-ups and demos, attributed to organic landing sessions.
- A rank tracker for the 30 to 50 priority keywords. Classify them first with our keyword intent classifier so the list is weighted toward commercial terms.
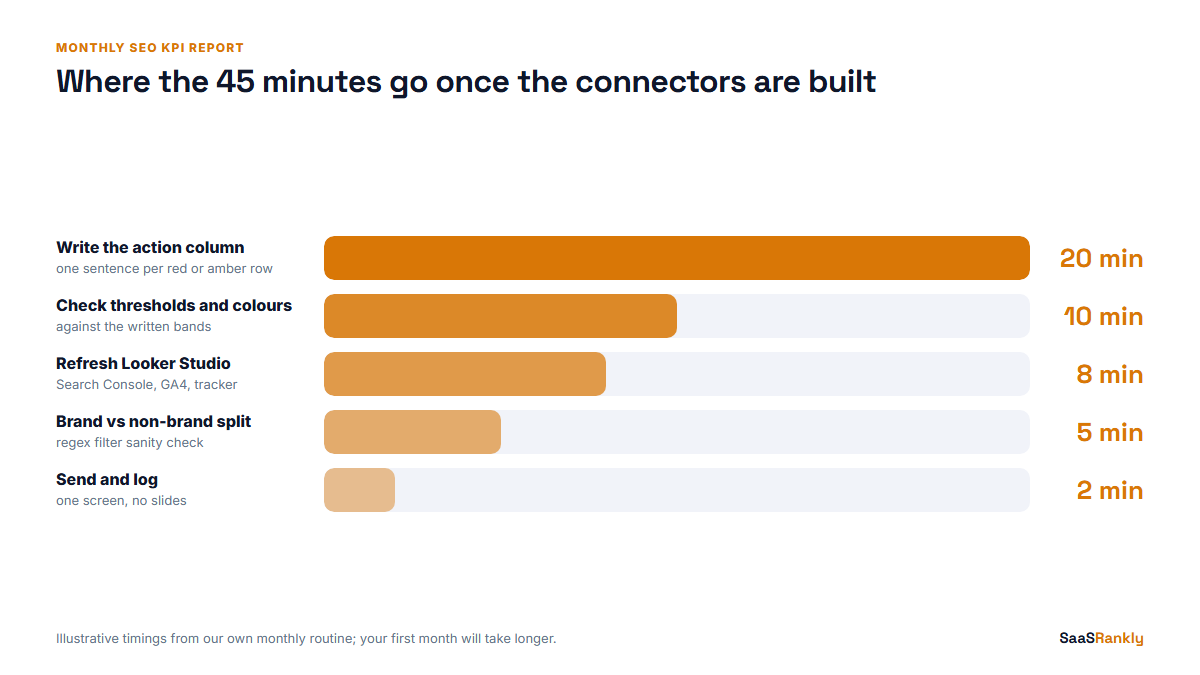
- Looker Studio to pull the three together on one page. Our walkthrough of a Data Studio SEO report has the connector setup.
- A human writing the action column. This part does not automate.
Once the connectors are built, a monthly SEO KPI report takes us about 45 minutes, almost all of it on the action column. Looker Studio is free; a basic rank tracker for 50 keywords runs around $30 to $50 a month at the time of writing. If a team tells you their KPI report takes two days, the template is the problem.
Cadence and who reads what
Monthly for the founder or CMO, with a quarterly version that adds a single revenue estimate: organic-attributed pipeline or MRR, using whatever attribution model sales already trusts. Do not invent a new model for SEO; it will be argued with forever. Our post on SEO ROI for SaaS shows how we turn the trial count into a payback number.
Weekly reports are a trap for SEO. Search data is noisy at that grain, and a weekly cadence trains people to react to noise. The exception is a migration or a major launch, where a weekly technical row is worth having for a month or two. Larger teams with several product lines can split the page per line, which is closer to the enterprise SEO dashboard layout.
Checklist before you send it
- Row 1 is a revenue-side number, not traffic.
- Every row has a year-on-year comparison where the data allows.
- Thresholds are written down and the colours follow them.
- Every red or amber row has a one-sentence action and an owner.
- Brand and non-brand clicks are separated.
- The whole thing fits on one screen without scrolling.
Quick recap: SEO KPI report
- Six rows, five columns, one page; revenue rows first, plumbing last.
- Compare against last month and the same month last year.
- Agree green, amber and red thresholds once, in writing.
- Keep the action column to one sentence per row.
- Move domain rating, total keywords and average position to a secondary tab.
- Build it in Looker Studio in about 45 minutes a month once connected.
FAQ
What should an SEO KPI report include?
Organic trials or demos, organic sign-up rate, clicks to money pages, non-branded clicks, priority keywords in the top 3, and a technical health check. Each with month-on-month and year-on-year comparisons.
How long should an SEO KPI report be?
One page or one screen. Supporting detail can live in tabs behind it, but the page a founder reads should take under two minutes.
How often should I send an SEO KPI report?
Monthly, with a quarterly version that adds a revenue or pipeline estimate. Weekly is too noisy for most SEO metrics outside a migration.
Should I include rankings in an SEO KPI report?
Only for a short list of 30 to 50 priority keywords, reported as a count in the top 3. Never as an average position across the whole site.
What is the difference between an SEO KPI report and an SEO report?
An SEO report can cover audits, content plans and link work. A KPI report is the narrow outcome view: is organic search producing customers, and is that getting better or worse.
Which tool is best for building an SEO KPI report?
Looker Studio is enough for most SaaS teams, since it is free and connects to Search Console and GA4 directly. Paid dashboard tools help only once you have several data sources beyond those two.