Most AI visibility reports fail in one of two ways. Either they are a wall of prompt-level screenshots nobody reads, or they are a single “AI visibility score” from a tool that nobody can explain. This guide sets out five metrics that a SaaS marketing lead can defend in a board deck, where each number comes from, and a one-page layout that puts them next to the Google numbers you already report.
This guide covers ai search visibility metrics for SaaS teams: what it means, why it matters, and the practical steps to get it right.
The five metrics
| Metric | Formula | Source | Answers the question |
|---|---|---|---|
| Mention rate | Runs where your brand is named divided by total runs, per prompt group and engine | Prompt tracker or spreadsheet | How often are we in the answer? |
| AI share of voice | Your mentions divided by total mentions of all brands in your competitor set | Prompt tracker | How do we compare with the five brands that matter? |
| Citations | Count of your URLs cited, last 30 days, and the list of pages | Prompt tracker; Search Console AI report for Google | Which of our pages do the engines trust? |
| AI impressions and clicks (Google) | Search Console generative AI performance view, by page group | Search Console | How much Google AI exposure and traffic are we actually getting? |
| AI referral signups | GA4 key events where session source is an AI domain | GA4 | Is any of this producing customers? |
The first three come from prompt tracking; set that up with the LLM rank tracking guide. The last two are first-party and free, and they are the ones leadership will trust most.
Metric 1 and 2: mention rate and share of voice
Report mention rate per prompt group (category, competitor, problem, brand) rather than as one blended number, because the groups behave differently. A 60 percent mention rate on brand prompts and 8 percent on category prompts is a clear story; a 30 percent average hides it. If you are new to the term, start with our explainer on LLM visibility, which covers the four things worth scoring before you build a report.
Share of voice needs a fixed competitor set. Pick five, write them into the report definition, and do not change them for at least two quarters. If a new entrant starts appearing, add a note, not a new denominator.
Show both as a monthly trend line per engine. A table of this month’s values with last month’s in a second column is enough for the report page; keep the charts in the appendix.
Metric 3: citations
Citations are the bridge between visibility and traffic, and they tell you what to write next. Report:
- Total citations in the last 30 days, per engine.
- The top ten cited pages. In our experience these are almost always comparison pages, integration pages, pricing pages and one or two definitive guides.
- Prompts where a competitor’s page is cited and yours is not. This list is the content backlog.
Metric 4: Google AI impressions and clicks
Search Console’s generative AI performance view (rolled out worldwide in mid 2026) reports impressions and clicks where your page appeared inside an AI Overview or AI Mode answer, filterable by page, query, country and device. Two things to do with it:
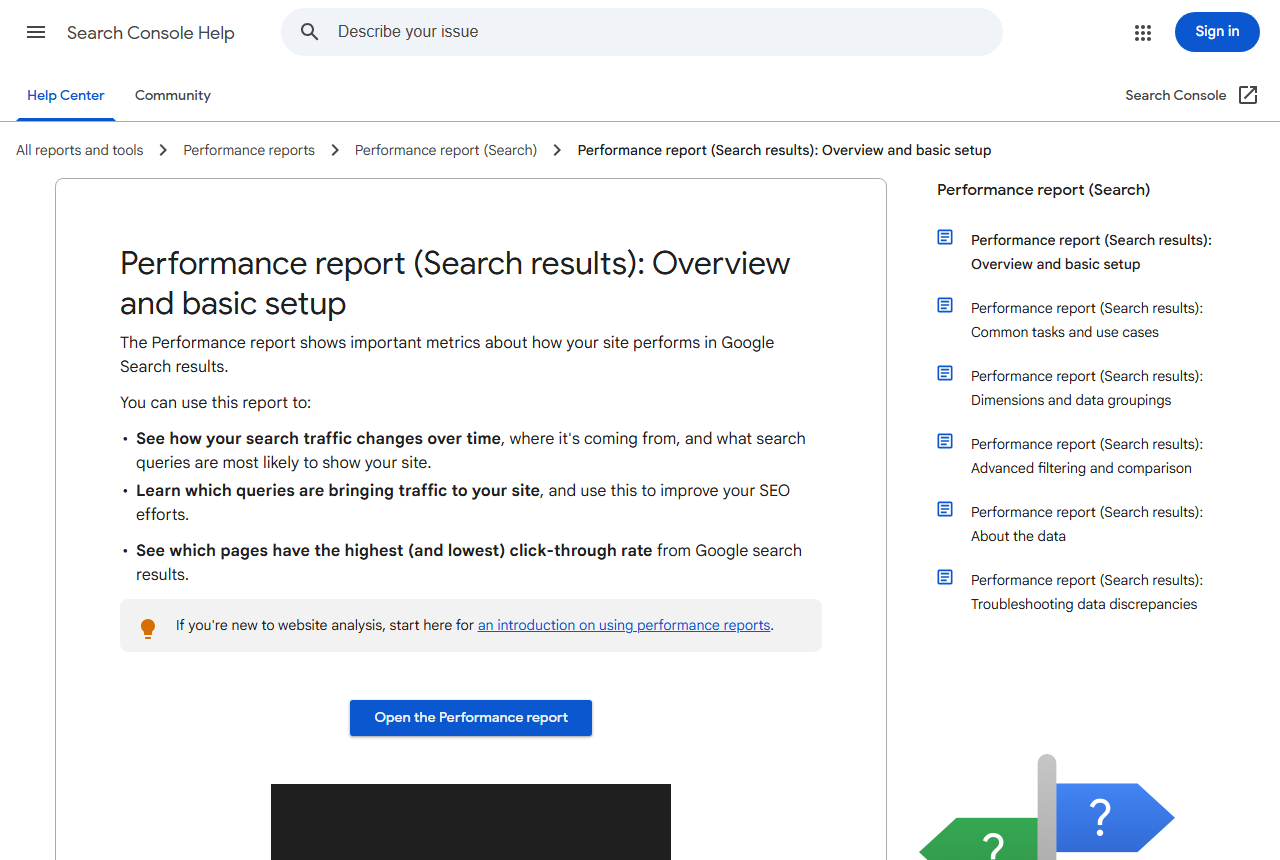
- Group by page type with the same regex filters you use for the normal Performance report; the Search Console and GA4 setup guide has them. Report AI impressions and clicks for money pages and for the blog separately.
- Compare AI click-through with classic click-through for the same pages. This is the honest measure of the AI Overviews click-through effect on your own site, and it is the number to show when someone asks “is AI killing our traffic”.
Metric 5: AI referral signups
Every AI engine that links out sends a referrer. In GA4, build a segment or an exploration where session source matches a regex like chatgpt\.com|openai\.com|perplexity\.ai|copilot\.microsoft\.com|gemini\.google\.com|claude\.ai, then report sessions, key events (signups or demo requests) and conversion rate. Two notes:
- Volumes will be small. A SaaS site with 50,000 organic sessions a month might see 300 to 800 AI referral sessions. Their conversion rate is usually two to four times organic, because the visitor arrives with a recommendation. Report signups and the rate, not sessions.
- Google AI Overview and AI Mode clicks are not separable in GA4; they arrive as google organic. Use Search Console for those, as above.
The one-page monthly report
Put it on the same page as the Google SEO numbers from your weekly SEO dashboard, as a second block. Five rows, two columns (this month, last month), one sentence of commentary per row.
| Row | Example | Commentary pattern |
|---|---|---|
| AI share of voice (category prompts, ChatGPT + AI Overviews) | 31 pct (up from 24) | What changed and which prompts drove it |
| Mention rate by group | Category 18 pct, competitor 41 pct, problem 27 pct, brand 88 pct | The weakest group and the planned fix |
| Citations, last 30 days | 57, top page: /compare/x-vs-y/ | New pages cited, pages that dropped |
| Google AI impressions and clicks (money pages) | 12,400 impressions, 310 clicks | Change versus classic results on the same pages |
| AI referral signups | 18 signups, 4.1 pct conversion | Source split and any notable page |
One number goes at the top of the block for leadership: AI share of voice on category prompts. Everything else supports it.
What not to report
- A vendor’s composite “AI visibility score” as the headline. Use it internally if you like, but the board cannot interrogate it. Share of voice with a named competitor set can be checked by anyone with a browser.
- Daily changes. Answers vary run to run. Weekly runs, monthly reporting.
- Sessions from AI referrals without signups. Small session numbers invite the wrong conclusion; the conversion rate is the story.
- Screenshots of individual answers in the main report. Keep two or three in an appendix for colour.
Frequently asked questions about AI search visibility metrics
What is a good AI share of voice?
It depends on category size. A challenger brand at 15 to 25 percent against five named competitors is doing well; a category leader should be above 40. The trend matters more than the level.
How do I measure AI visibility without a paid tool?
Search Console’s AI report and a GA4 referral segment are free and cover Google exposure and AI referral signups. Add a manual monthly run of 20 to 25 prompts in a spreadsheet for mention rate and citations.
Can I attribute revenue to AI search?
Partly. AI referral signups are directly attributable through GA4. Mentions that lead to a branded Google search or a direct visit are not, which is why brand search volume is worth watching alongside these metrics.
How often should the AI visibility report go out?
Monthly, as a block inside the existing SEO report. A separate weekly AI report creates noise and meetings.
Quick recap: Ai search visibility metrics
Ai search visibility metrics usually comes down to a short, repeatable checklist. Use this whenever ai search visibility metrics comes up again:
- Diagnose ai search visibility metrics by checking the relevant report first, not assumptions.
- Confirm the current setup is actually causing ai search visibility metrics before you change anything.
- Re-check ai search visibility metrics again after the fix ships, not before.
Treat ai search visibility metrics as an ongoing signal rather than a one-time fix. For background on the platform rules behind this, see Google Search Central.