SEO ROI is the number your CFO asks for and the number most SaaS marketing teams cannot produce without hand-waving. This guide gives you a formula that survives a board meeting, a worked example with real-looking numbers, the three mistakes that inflate SEO ROI on paper, and a simple spreadsheet layout you can copy. It is written for SaaS, where the value of a signup is not the first invoice but the lifetime of the account.
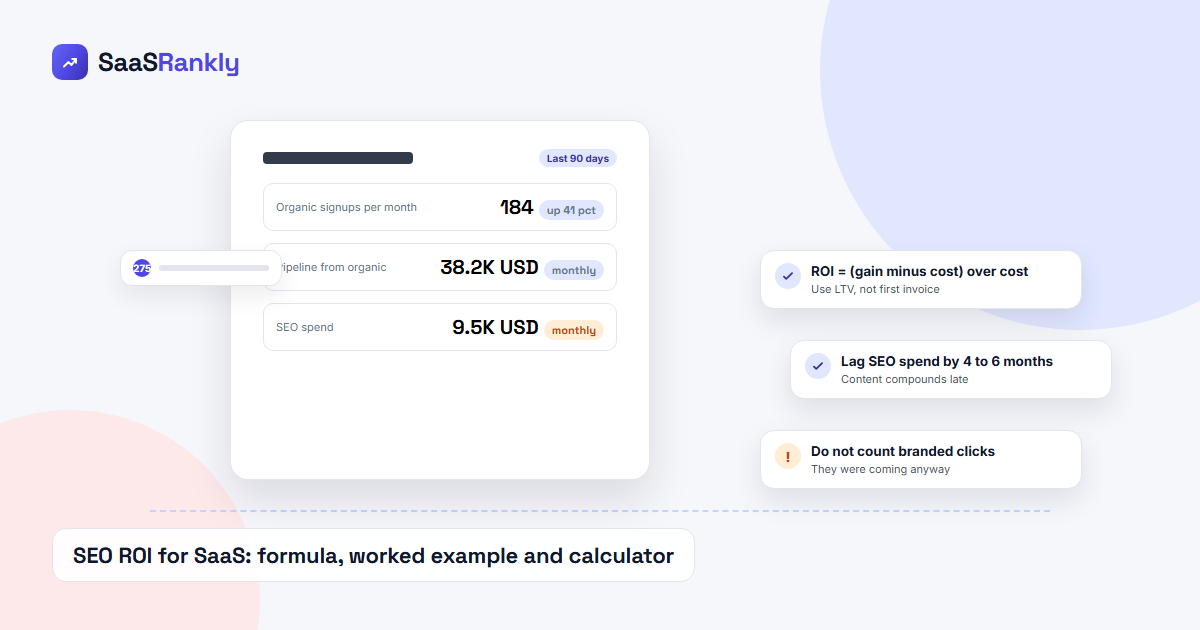
The SEO ROI formula for SaaS
The basic return on investment formula is:
SEO ROI = (Revenue attributable to organic search minus SEO cost) divided by SEO cost
That is fine for an ecommerce store where a click becomes an order the same day. SaaS needs two adjustments.
First, replace “revenue” with gross-margin lifetime value of the accounts organic search produced. A 49 dollar a month plan that retains for 20 months at 80 percent gross margin is worth 784 dollars, not 49.
Second, lag the cost. Content published in January usually peaks in traffic four to eight months later. If you compare this month’s cost with this month’s revenue, you will under-report SEO ROI during a build phase and over-report it once you stop investing.
The SaaS version therefore reads:
SEO ROI (period) = (Organic signups in period multiplied by conversion to paid multiplied by LTV multiplied by gross margin, minus SEO cost in the lagged period) divided by SEO cost in the lagged period
What counts as SEO cost
Under-counting cost is the most common way SEO ROI gets inflated. Include:
- Salaries or contractor fees for anyone spending time on SEO, prorated by hours
- Content production: writers, editors, designers, screenshots
- Tools: rank trackers, keyword research, crawlers, AI visibility trackers. If you are trimming this line, see our Semrush alternatives comparison
- Link building and digital PR spend
- Engineering time on technical SEO tickets
- Agency retainers
Do not include brand spend, paid search, or the cost of the product itself. Do include the share of a developer’s sprint that went to fixing crawl issues, because that is real money the CFO can see.
What counts as organic revenue
This is where most SEO ROI calculations go wrong in the other direction. Three rules:
- Exclude branded organic. People searching your product name were coming anyway. Filter branded queries out in Search Console and segment branded landing pages out in GA4. Counting them makes SEO ROI look spectacular and makes nobody trust the number.
- Use the same attribution model as paid. If paid search is measured on last non-direct click, measure organic the same way. Mixing models is how two channels both claim the same signup.
- Take conversion to paid and LTV from finance, not from marketing. Use the trailing 12-month figures for the same plan mix your organic signups land on. Organic traffic often skews to lower tiers, and using the blended LTV overstates it.
The setup for pulling organic signups by landing page and query is in measuring SaaS SEO with GA4 and Search Console.
A worked SEO ROI example
Here is a fictional but realistic B2B SaaS at around 2 million ARR after nine months of an SEO program.
| Input | Value | Source |
|---|---|---|
| Non-branded organic sessions, month 9 | 41,000 | GA4, branded pages excluded |
| Trial signups from those sessions | 184 | GA4 conversion, last non-direct click |
| Trial to paid rate | 22 pct | Finance, trailing 12 months |
| New paid accounts from organic | 40 | 184 x 0.22 |
| Average LTV per account | 1,180 USD | Finance, same plan mix |
| Gross margin | 81 pct | Finance |
| Gross-margin LTV created | 38,232 USD | 40 x 1,180 x 0.81 |
| SEO cost, months 3 to 5 (lagged) | 28,500 USD | Salaries, content, tools, links |
SEO ROI for month 9 = (38,232 minus 28,500) divided by 28,500 = 34 percent
Thirty-four percent on a three-month lag is a good but not extraordinary result at month nine. The important part is the trend: the same calculation at month six was negative, and at month twelve, with the cost base flat and signups compounding, it usually crosses 100 percent. Present SEO ROI as a curve, not a single number.
Why SEO ROI looks different from paid search ROI
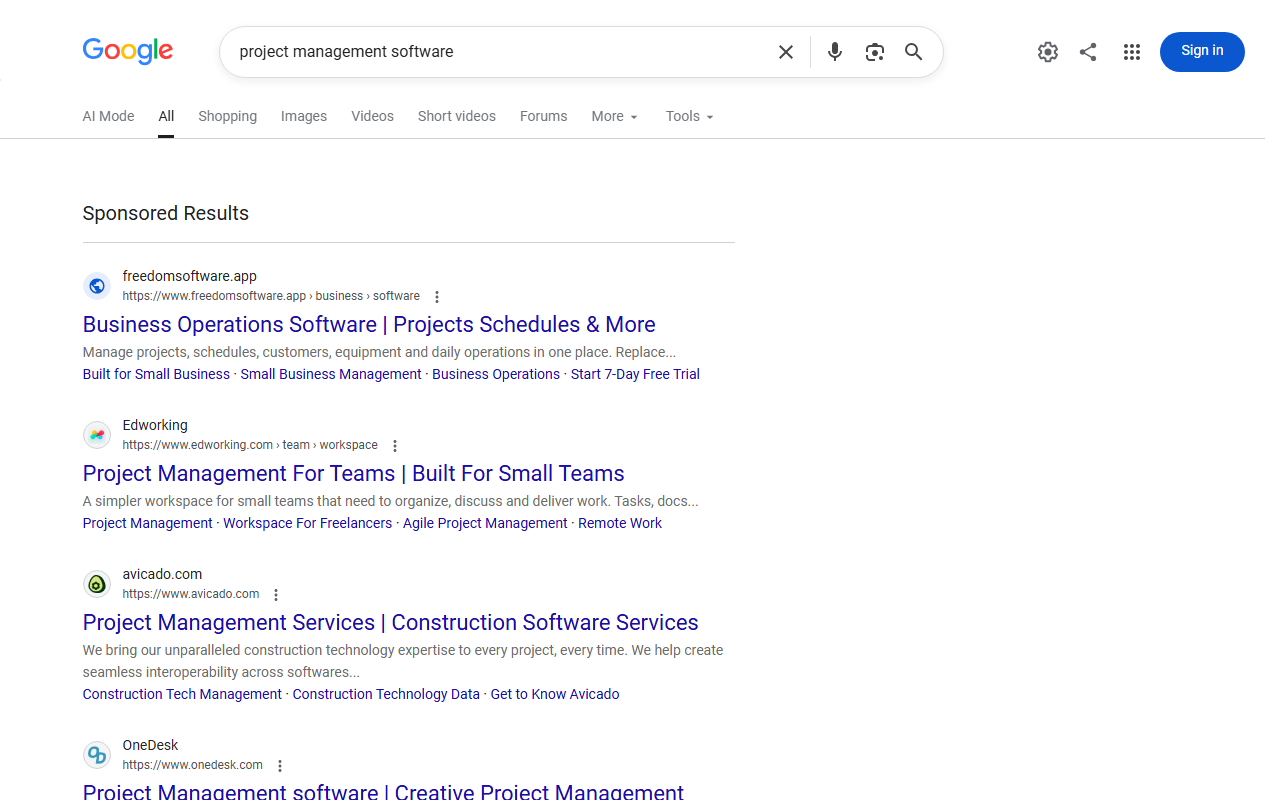
Paid search ROI is measured in days and stops the moment you pause spend. SEO ROI is measured in quarters and keeps paying after you stop. That makes the two channels hard to compare on the same chart, and it is why the top of a SaaS SERP is full of ads paying real money per click for terms your content could own. For how SEO compares with paid search, referrals and outbound on the same payback formula, see our breakdown of SaaS marketing channels.
A useful bridge is equivalent paid value: multiply your non-branded organic clicks by the average CPC for those queries. It is not revenue, and you should never present it as ROI, but it tells a CFO what the same traffic would have cost through Google Ads. For most SaaS categories that number is five to ten times the SEO budget, which is usually enough to keep the program funded while the LTV-based SEO ROI curve catches up.
The three mistakes that inflate SEO ROI
1. Counting branded traffic
Covered above, but worth repeating. If a third of your organic sessions come from your brand name and you include them, your SEO ROI is fiction.
2. Using first-invoice revenue instead of LTV, then switching to LTV when it looks better
Pick one model and keep it. If finance prefers a conservative 12-month revenue horizon instead of full LTV, use that consistently. Consistency is what makes the number trusted.
3. Ignoring the cost of engineering time
Technical fixes such as the ones in our indexing problems guide are real cost. Leaving them out understates cost and overstates SEO ROI.

How to build the SEO ROI spreadsheet
One tab, twelve monthly rows, these columns:
- Month
- Non-branded organic sessions (GA4)
- Trial signups from non-branded organic
- Trial to paid rate (finance, quarterly refresh)
- New paid accounts (col 3 x col 4)
- Gross-margin LTV per account (finance)
- Value created (col 5 x col 6)
- SEO cost this month
- SEO cost lagged by 4 months (reference col 8 four rows up)
- SEO ROI = (col 7 minus col 9) divided by col 9
- Equivalent paid value = non-branded clicks x average CPC
Chart column 10 as a line and column 11 as bars. That single chart, updated monthly, is the whole SEO ROI conversation. If you already run a reporting dashboard, the same columns drop into the template in our SaaS SEO reporting dashboard guide.
What “good” SEO ROI looks like for SaaS
Benchmarks vary by category and there is no reliable public dataset, so treat the following as ranges from the programs we have seen rather than industry statistics:
- Months 1 to 6: negative. Content is being produced, nothing has ranked yet.
- Months 6 to 12: crosses zero, typically between 20 and 80 percent on a lagged basis.
- Year 2 onward: 150 to 400 percent is common for a program that kept publishing and fixed technical debt. Programs that stopped publishing plateau and decay.
The exception is a site that already has domain authority and launches a new product. There, SEO ROI can be positive within a quarter because the domain is already trusted.
SEO ROI by content type
Not all organic traffic carries the same value, and a blended SEO ROI hides that. Splitting the calculation by page type shows where the return actually comes from and where to put the next dollar. The ranges below are typical patterns for B2B SaaS, not benchmarks:
| Page type | Traffic share | Share of organic signups | SEO ROI pattern |
|---|---|---|---|
| Comparison and alternatives pages | 5 to 10 pct | 30 to 50 pct | Highest. Cheap to produce, converts fast. |
| Integration and template pages | 10 to 25 pct | 15 to 25 pct | High once built, near-zero marginal cost. |
| Pricing and product pages | 5 pct | 15 to 20 pct | High, mostly branded, exclude from SEO ROI. |
| How-to and glossary content | 50 to 70 pct | 5 to 15 pct | Lowest and falling as AI Overviews absorb clicks. |
The practical conclusion is uncomfortable for content teams: the pages that make SEO ROI positive are usually the boring commercial ones. See high intent keywords for SaaS for how to find and prioritise them.
Presenting SEO ROI to the board
Three slides are enough. Slide one: the twelve-month SEO ROI curve with the lag stated in the footnote. Slide two: the equivalent paid value bar next to actual SEO spend, so the alternative cost is visible. Slide three: organic signups by page type, so the board sees which investments produced the return. Avoid traffic charts entirely. Traffic is an input, and every board has seen a traffic chart go up while revenue stayed flat.
If SEO ROI is still negative because the program is under six months old, show the leading indicators instead: number of pages ranking in the top 20 for commercial keywords, non-branded impressions, and the signup rate on the pages that already rank. Those three predict the SEO ROI curve months before it turns positive, and they are honest.
Quick recap: seo roi
- SEO ROI = (organic value created minus SEO cost) divided by SEO cost. For SaaS, value means gross-margin LTV of the accounts organic search produced.
- Lag cost by four to six months so the SEO ROI curve reflects how content actually ranks.
- Exclude branded traffic, use the same attribution model as paid, and take LTV from finance.
- Count engineering time, tools and links as SEO cost, not just content.
- Present SEO ROI as a monthly curve plus an “equivalent paid value” bar, never as one number.
- Expect negative SEO ROI for the first six months and 150 percent plus by year two if you keep publishing.
FAQ
How do you calculate SEO ROI?
Subtract SEO cost from the revenue (for SaaS, gross-margin lifetime value) that organic search produced, then divide by SEO cost. Lag the cost by a few months to account for ranking delays.
What is a good SEO ROI for a SaaS company?
Negative in the first six months, 20 to 80 percent by month twelve on a lagged basis, and 150 percent or more in year two for programs that keep investing. Anything reported above 1,000 percent usually includes branded traffic.
Should branded search be included in SEO ROI?
No. Branded searches are the result of product, sales and brand work, not SEO. Including them makes the number unbelievable to finance.
How long does it take to see SEO ROI?
Typically six to twelve months for a new SaaS domain, faster for an established domain launching new content.
Is there a free SEO ROI calculator?
The eleven-column spreadsheet in this article is the calculator. Any tool that produces a number without asking for LTV, gross margin and lagged cost is guessing.
How do I compare SEO ROI with paid search ROI?
Use the same attribution model for both, then add “equivalent paid value” (organic clicks times average CPC) as a bridge metric. Do not present that bridge metric as ROI.