Most SERP metrics dashboards we get asked to review track twenty numbers and act on two. This guide sorts SERP metrics into the ones that change what a SaaS team does next week and the ones that only look good in a slide. If a number cannot trigger a decision, it goes in the appendix, not on the first screen.
Short version first. Track position by page, not by keyword. Track impressions and CTR together, never alone. Track which SERP features sit above you. Everything else is context. Before tuning any of these, it helps to be clear on what an organic listing is in the first place; our explainer on organic results separates them from ads, AI answers and the other blocks on the page.
What counts as a SERP metric (and what does not)
A SERP metric describes how your page shows up on the results page itself: where it sits, how often it is seen, how often it is clicked, and what else is competing for the same screen. Traffic, sign-ups and pipeline happen after the click, so they are outcome metrics. Keep the two groups apart. When a SaaS team mixes them in one chart, a drop in trial sign-ups gets blamed on rankings that did not move at all.
The clean source for most SERP metrics is the Search Console performance report. It gives you four numbers per query and per page: clicks, impressions, CTR and average position. Rank trackers add the parts Search Console does not show well, like which features appear and who holds them. For exact positions on top of those averages, our free SERP rank tracker comparison lists what each free tool can and cannot track.
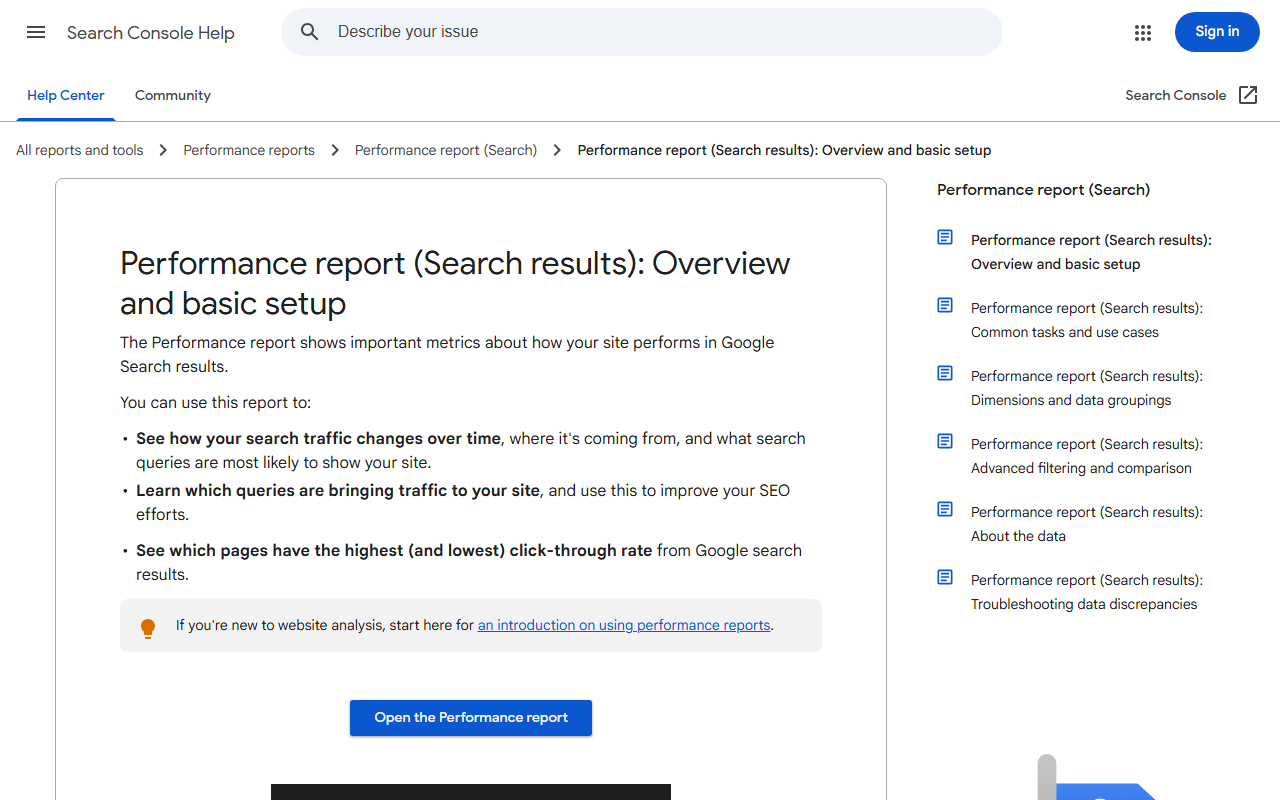
The SERP metrics we keep on the first screen
These five earn a place because each one points to a specific fix. The table shows the metric, the question it answers, and the action it usually leads to.
| SERP metric | Question it answers | Typical action |
|---|---|---|
| Average position by page | Is this page moving toward page one? | Pages stuck at 8 to 20 get internal links and a content refresh first |
| Impressions by page | Is Google testing this page on more queries? | Rising impressions with flat clicks means the title needs work |
| CTR at a given position | Is our snippet winning the click it should? | Rewrite title and description when CTR sits well under the norm for that slot |
| SERP features above the result | How far down the screen is position 3, really? | Target the feature (snippet, video, AI Overview citation) instead of the rank |
| Query count per page | How wide is this page ranking? | A page with 300 queries is a hub, protect it; one with 4 needs broader coverage |
Notice what is missing: total keyword count across the site, “visibility score” from a third-party tool, and average position across the whole domain. We will get to those.
CTR by position: the SERP metric people misread most
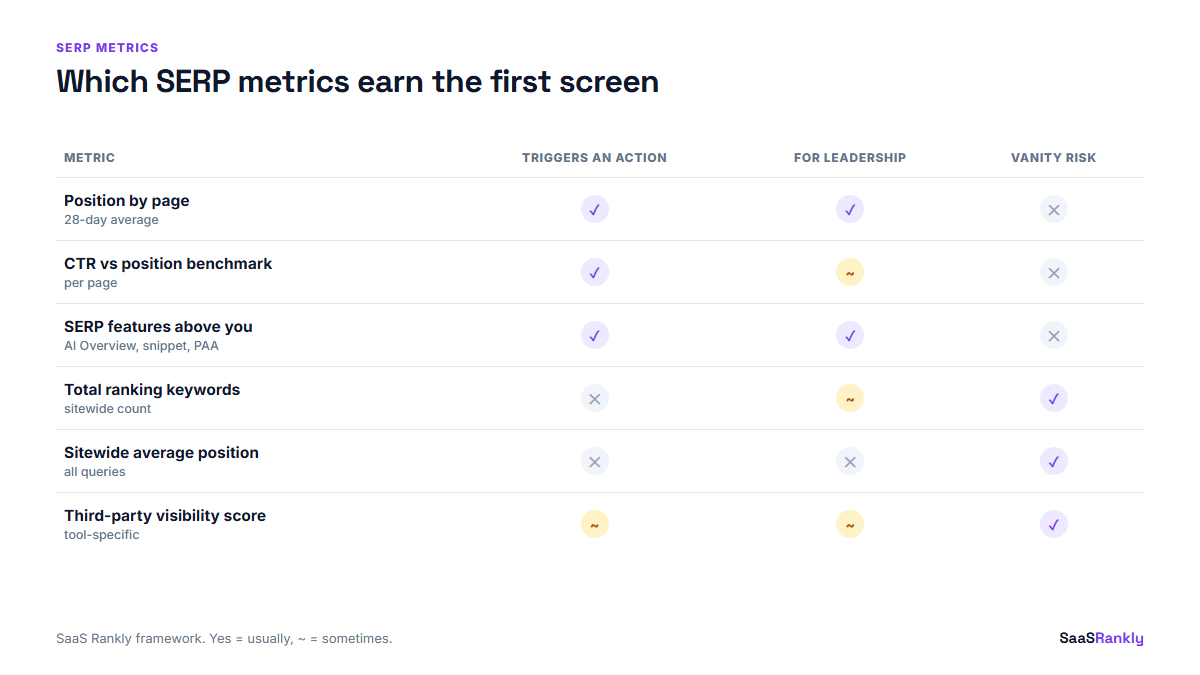
Average CTR tells you almost nothing on its own. A 2 percent CTR is poor for position 2 and fine for position 9. The useful version compares your CTR for a page against a benchmark curve for its position. Public CTR studies, such as the Advanced Web Ranking CTR study, publish those curves by position, device and intent, and they update as SERP layouts shift.
Here is an illustrative worked example. The numbers are made up to show the method, not pulled from a client account.
| Page | Avg position | Impressions (28 days) | CTR | Rough benchmark for that slot | Verdict |
|---|---|---|---|---|---|
| /pricing-comparison/ | 3.1 | 4,200 | 2.4 pct | around 8 to 10 pct | Snippet problem, rewrite title |
| /integrations/slack/ | 6.8 | 1,900 | 3.9 pct | around 3 to 4 pct | Fine, leave it |
| /blog/churn-formula/ | 11.2 | 7,600 | 0.6 pct | around 1 pct | Ranking problem, not snippet |
The first row is the one worth an afternoon. Position 3 with a 2.4 percent CTR usually means one of three things: an AI Overview or a featured snippet is pushing the result below the fold, the title reads like a category page when the searcher wanted a comparison, or a competitor has review stars and you do not. Check the live SERP before you rewrite anything. We use our SERP snippet preview tool to test title lengths before pushing changes, because a rewrite that truncates at 55 characters can make CTR worse.
SERP feature metrics: what sits above you
Position 1 in 2019 and position 1 today are different screens. For many SaaS queries the organic results now start after an AI Overview, a “People also ask” box, sponsored results and sometimes a video carousel. A rank tracker that only reports “position 1” hides all of that. For how that crowded layout changes what a SaaS page has to do to earn the click, see our breakdown of SERPs SEO for SaaS pages.
Track two things per priority keyword:
- Features present: AI Overview, featured snippet, PAA, video, sitelinks, reviews. A plain yes or no per feature is enough.
- Features you own: are you cited in the AI Overview, do you hold the snippet, do your pages appear in PAA answers.
If a keyword gains an AI Overview and your CTR drops while position holds, that is not an SEO failure. It is a layout change, and the fix is to earn the citation. We wrote up how we approach that in PAA answers moving into AI Overviews, and the broader feature list is in our guide to SERP features for SaaS.
Vanity SERP metrics to demote
These are not useless. They are just poor at telling you what to do. Put them on a secondary tab.
- Total ranking keywords. It climbs when you rank 80th for 400 long-tail terms nobody clicks. A site can double this number and see no change in traffic.
- Sitewide average position. One new page ranking 70th for 200 queries drags the average down even when every money page improved. It punishes you for publishing.
- Third-party visibility scores. Each tool calculates them differently from its own keyword set and its own CTR model. Useful for comparing yourself to a rival inside one tool, weak as an absolute.
- Keywords in top 3, counted without volume. Ten top-3 rankings on zero-volume terms look identical in the count to ten top-3 rankings that drive pipeline.
- Daily rank changes. Positions wobble by 1 to 3 spots day to day. Weekly or 28-day averages are what you act on.
The mistake we see most is a team reporting total ranking keywords to leadership as the headline. When that number flattens (and it will), the SEO programme looks stalled even while revenue pages are climbing.
How to report SERP metrics to a SaaS leadership team
Leadership does not need twenty SERP metrics. They need three lines and one sentence of interpretation:
- Money pages: how many sit in the top 5, top 10, and 11 to 20, versus last month.
- Impressions and clicks for those pages, 28 days versus the previous 28.
- One SERP layout change that matters (for example, “AI Overview now appears on 6 of our 20 priority terms”).
Then connect it to outcomes in a separate row: organic sign-ups and demo requests. Our SaaS SEO reporting dashboard post has a layout for this, and measuring SaaS SEO with GA4 and GSC covers the joins between the two tools.
Where each SERP metric comes from
| Metric | Best source | Watch out for |
|---|---|---|
| Clicks, impressions, CTR, position | Google Search Console | Anonymised queries are dropped from query-level totals |
| SERP features present | A rank tracker with feature tracking | Location and device settings change the layout |
| AI Overview citations | AI visibility tools or manual checks | Results vary by session, sample more than once |
| Competitor positions | Rank tracker | Only covers keywords you chose to track |
If you are picking a tracker, our comparison of rank tracker tools lists which ones report SERP features and which only give positions.
Quick recap: SERP metrics
- SERP metrics describe the results page; traffic and sign-ups are outcomes, report them separately.
- Track position by page, not a sitewide average.
- Read CTR against a benchmark for that position, never as a raw number.
- Log which SERP features sit above you and which ones you own.
- Demote total keyword counts and third-party visibility scores to a secondary tab.
- Give leadership three lines: money page positions, impressions and clicks, one layout change.
FAQ
What are the most important SERP metrics for a SaaS site?
Average position by page, impressions, CTR compared with the benchmark for that position, and the SERP features that appear above your result. Those four explain most ranking and traffic changes.
Is average position a reliable SERP metric?
At page level over 28 days, yes. At sitewide level, no. The sitewide number falls every time you publish a new page that ranks low for many long-tail terms.
How often should I check SERP metrics?
Weekly for priority pages, monthly for the full report. Daily checks mostly show normal volatility of a few positions.
Why did my CTR drop when my ranking stayed the same?
Usually a layout change: an AI Overview, a featured snippet or ads now appear above you. Check the live SERP before changing your title.
Do third-party visibility scores matter?
They help when comparing yourself with a competitor inside the same tool. As an absolute measure they are weak, because each tool uses its own keyword set and CTR model.
Can I get SERP metrics for free?
Search Console gives clicks, impressions, CTR and position for free. For SERP feature tracking you need a rank tracker, and several have free tiers for a small keyword list.