Keyword ranking distribution is the share of your tracked or ranking keywords that sit in each band of Google positions: 1 to 3, 4 to 10, 11 to 20, and so on. We like it more than average position because it shows movement that an average hides. A site can hold the same average position for three months while forty keywords climb from page three to page two, and that climb is the thing that predicts next quarter’s clicks.
This guide covers how we build a keyword ranking distribution from Search Console data for free, which bands we use and why, what the common shapes of the chart usually mean, and the mistakes that make the chart lie. It is written for SaaS teams with a few hundred to a few thousand ranking queries, which is where most of the sites we work on sit.
Why average position is not enough
Average position is a single number, and single numbers flatten everything interesting. Publish twenty new pages that each rank at position 60 for a handful of long-tail terms and your sitewide average gets worse, even though nothing you already had moved down. We have sat in meetings where that exact pattern was read as “SEO is declining” while the revenue pages were climbing.
A keyword ranking distribution separates those two stories. The new pages show up as growth in the 51 to 100 band. The revenue pages show up as movement from 11 to 20 into 4 to 10. Both are visible on one chart, and neither cancels the other out. If you want the wider set of SERP numbers worth tracking next to it, our post on SERP metrics that change decisions sorts the useful ones from the vanity ones.
The position bands we use
There is no official set of bands. Every rank tracker picks its own, which is one reason two tools never agree. These are the five we use on almost every SaaS account, with the reason for each cut.
| Band | What it means in practice | Typical CTR range | What we do with keywords here |
|---|---|---|---|
| 1 to 3 | You own the click, unless an AI Overview or ads push you down the screen | 10 to 35 percent | Protect: refresh yearly, watch for snippet loss |
| 4 to 10 | Page one, but below the fold on most phones | 2 to 8 percent | Push: titles, internal links, better intent match |
| 11 to 20 | Page two, almost no clicks, but Google already trusts the page | under 1 percent | The best opportunity band for most sites |
| 21 to 50 | Relevant but not competitive yet | near zero | Check intent; often needs a new or merged page |
| 51 to 100 | Long-tail noise and very new pages | zero | Ignore individually, watch the count over time |
The CTR ranges are rough and depend heavily on the SERP layout. A branded query at position 1 can pull 50 percent; a commercial query under four ads and an AI Overview might pull 8. We use public curves as a starting point and replace them with the site’s own numbers once there is enough data.
How to build a keyword ranking distribution from Search Console
You do not need a paid rank tracker for this. Search Console already has the position data, with two caveats we will come back to. Here is the process we run each month.
- Export queries for the last 28 days. Performance report, Search results, Queries tab, export to Sheets. The interface caps the export at 1,000 rows, so on bigger sites use the Search Analytics API, which returns up to 25,000 rows per request. Our guide to getting keyword data out of Search Console covers the export in more detail.
- Filter out branded queries. Brand terms sit at position 1 and inflate the top band. A simple regex on your brand name and its common misspellings is enough.
- Drop queries with fewer than 10 impressions. Below that, the position figure is too unstable to bucket. We have seen a query jump from 4 to 60 and back in a week on three impressions.
- Bucket each query. One formula column: an IFS on the position value that returns “1-3”, “4-10” and so on.
- Count and chart. A pivot of query count by band, then a stacked bar per month. Keep at least three months side by side, because one month on its own tells you almost nothing.
- Add an impressions view. Count of keywords per band is one chart; total impressions per band is a second. The second one stops a pile of zero-volume long-tail terms from dominating the picture.
The whole thing takes about 20 minutes once the sheet exists. A paid tool will give you daily data and fixed keyword sets, which is better for a tight list of money keywords. For the free options and where each one stops, see our comparison of free SERP rank trackers.
A worked example (illustrative)
Here is a fictional B2B SaaS, a contract management tool we will call Clausely, over three months. The numbers are invented but they follow a pattern we see often after a content push. Non-branded queries only, 10+ impressions each.
| Band | July | August | September | Change |
|---|---|---|---|---|
| 1 to 3 | 18 | 19 | 22 | +4 |
| 4 to 10 | 41 | 47 | 63 | +22 |
| 11 to 20 | 96 | 118 | 121 | +25 |
| 21 to 50 | 210 | 244 | 226 | +16 |
| 51 to 100 | 132 | 205 | 238 | +106 |
| Total | 497 | 633 | 670 | +173 |
| Average position | 34.1 | 37.8 | 36.9 | worse |
Read only the average and Clausely looks like it is sliding: 34.1 to 36.9. Read the keyword ranking distribution and the story flips. Page one grew from 59 to 85 keywords, a 44 percent increase. The 11 to 20 band filled up in August and then held, which tells us some of those keywords crossed onto page one in September. The 51 to 100 band almost doubled because of new pages, and that is what dragged the average down.
Clicks for Clausely went from 1,900 to 2,600 a month over the same period. The average position would never have explained that. The distribution does.
What the shape of the chart usually means
After a few months the stacked bars settle into a shape. These are the patterns we see most, and the first thing we check for each one. Treat it as a decision matrix, not a diagnosis.
| Pattern | Likely cause | First check |
|---|---|---|
| Bottom bands grow, top bands flat | Lots of new content, not yet trusted | Normal for 3 to 6 months; check internal links to the new pages |
| 11 to 20 band large and stuck for 3+ months | Pages are relevant but weaker than page one competitors | Compare intent and depth with the top 5; look for missing backlinks |
| 4 to 10 shrinks, 11 to 20 grows | A core update or a competitor refresh | Check the dates against known updates before touching content |
| 1 to 3 drops, clicks drop more | Lost featured snippets or a new AI Overview | Look at the live SERP for the top 10 lost keywords |
| Every band shrinks at once | Technical issue: indexing, redirects, robots rules | Page indexing report and a crawl, today |
The last row is the one worth an alert. A sitewide drop across every band almost never comes from content quality. It is usually a deploy that changed canonical tags, a robots.txt edit, or a migration that lost redirects.
Turning the distribution into a work list
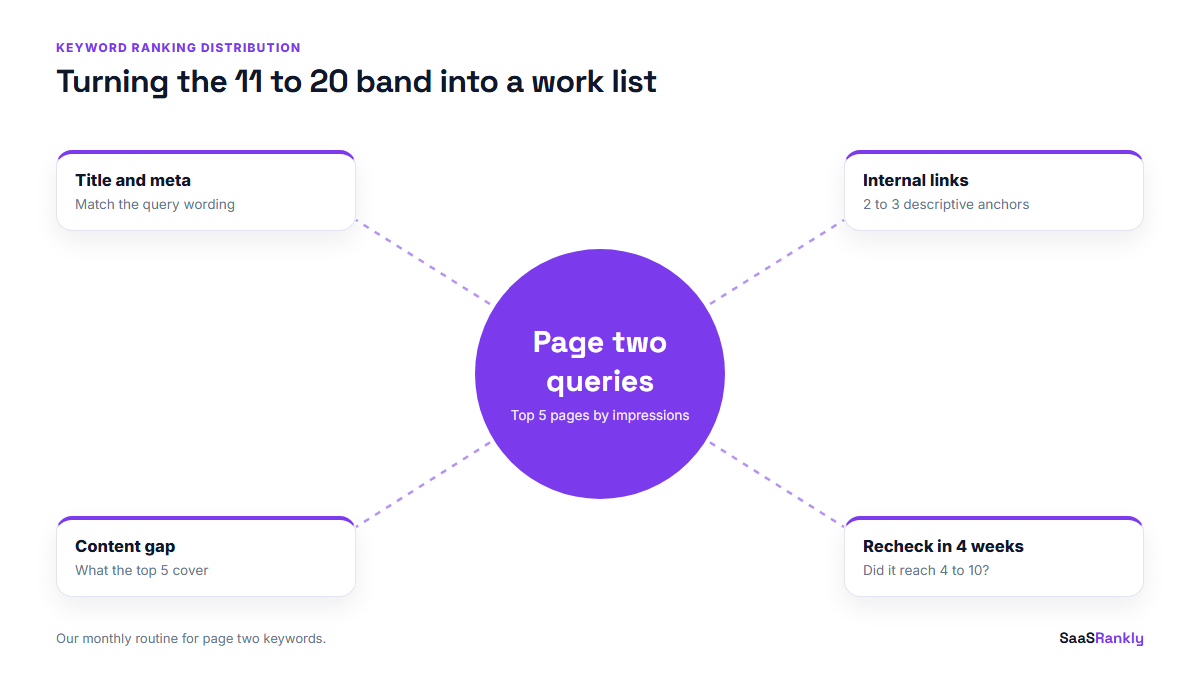
A chart nobody acts on is decoration. The reason we bother with keyword ranking distribution at all is the 11 to 20 band, because it doubles as a shortlist. Those are pages Google already considers relevant, sitting one step from real clicks.
Each month we pull the 11 to 20 queries with the most impressions, group them by landing page, and pick the five pages with the most impression volume stuck on page two. For each page we do three things: tighten the title and meta description to match the query (our SERP snippet preview tool helps with lengths), add two or three internal links from related posts with descriptive anchors, and fill the gap the top five results cover that the page does not.
That routine is boring, and in our experience it beats publishing five new posts most months. If you want to put a click number on what those moves could be worth, the same bands slot straight into an SEO traffic projection.
Mistakes that make a keyword ranking distribution misleading
- Mixing branded and non-branded queries. Brand terms pin the top band and hide real movement.
- Comparing different keyword sets. Search Console reports whatever queries showed you that month. If the set grows, every band can grow. Track a fixed set of priority keywords alongside it.
- Reading one month in isolation. Single months bounce. Three is the minimum, six is better.
- Ignoring device. Mobile and desktop positions can differ by several places. If 70 percent of your traffic is desktop, as it is on many B2B sites, chart desktop on its own.
- Trusting averaged positions on low-impression queries. Search Console reports the average of the topmost position across impressions. On 3 impressions that number is close to random.
- Reporting it to leadership without clicks. The distribution is a leading indicator. Put organic clicks and signups next to it, as we do in our SEO KPI report format, so nobody mistakes movement for revenue.
Quick recap: keyword ranking distribution
- A keyword ranking distribution counts your keywords in position bands instead of averaging them.
- We use five bands: 1 to 3, 4 to 10, 11 to 20, 21 to 50 and 51 to 100.
- Search Console is enough to build it for free; use the API past 1,000 rows.
- Filter brand terms and queries under 10 impressions before you bucket.
- The 11 to 20 band is the monthly work list.
- Read three or more months together, with clicks beside it.
FAQ
What is a keyword ranking distribution?
It is a count of how many of your keywords rank in each range of Google positions, such as 1 to 3, 4 to 10 and 11 to 20. It shows where your rankings sit and how they move between ranges over time.
Is keyword ranking distribution better than average position?
For trend reading, yes. Average position gets worse every time you publish pages that start low, even if your important keywords improve. The distribution shows both movements separately.
Can I build it with Google Search Console only?
Yes. Export queries with their average position, filter out branded and very low impression queries, bucket the positions in a spreadsheet and chart the counts per month. Larger sites need the Search Analytics API because the interface export stops at 1,000 rows.
Which position band should I focus on first?
Positions 11 to 20 for most SaaS sites. Google already sees those pages as relevant, and moving them onto page one usually takes on-page and internal linking work rather than new content.
How often should I check the distribution?
Monthly is enough for most teams. Weekly data is noisy, and the useful signal is the direction across three or more months.
Why do rank trackers show a different distribution from Search Console?
Rank trackers check a fixed keyword list from one location and device, usually once a day. Search Console averages real impressions across all locations and devices. Both are correct for what they measure, so pick one source for reporting and stay with it.