ROI content marketing questions usually arrive in a budget meeting, phrased as “what did we get for the $8,000 a month we spend on the blog?” Most SaaS teams cannot answer, not because content does not pay back, but because nobody set up the maths before the first post went live. This guide gives you the formula we use, the costs people forget, the attribution choices that swing the answer, and a worked example you can copy into a spreadsheet.
We will be blunt about one thing up front. Content ROI is slow. A post written this month usually earns most of its return in months 6 to 24. Any report that judges content on a 90 day window will call it a loss, and that report will be wrong.
The ROI content marketing formula, and why the simple version lies
The textbook formula is short: ROI equals revenue from content minus the cost of content, divided by the cost of content. If you spent $10,000 and content brought in $30,000, your ROI is 200 percent.
The problem is that both inputs are fuzzy. “Revenue from content” depends on how you credit a customer who read three posts, clicked an ad and then signed up after a sales call. “Cost of content” depends on whether you count the salary of the marketer who briefs the writers. Change either assumption and the same programme can show 40 percent or 400 percent.
So before you touch the formula, write down three decisions and get your finance lead to agree to them:
- Which costs count, including people time.
- Which attribution model decides what revenue content gets credited with.
- Which time window you measure over, and whether you use revenue or gross margin.
Once those are fixed, the number means something and you can compare quarters. Without them, every ROI content marketing debate becomes an argument about method.
Step 1: count the full cost
In ROI content marketing audits, teams undercount cost more often than they overcount revenue. The invoice from the freelance writer is the visible part. Here is the full list we use when we audit a content budget.
| Cost line | Often forgotten? | How to price it |
|---|---|---|
| Writers and editors | No | Invoices, or salary share for in-house staff |
| Briefing and review time | Yes | Hours per post times the loaded hourly rate |
| Subject matter expert time | Yes | Engineer or founder hours at their loaded rate |
| Design and images | Sometimes | Designer hours or stock and tool subscriptions |
| SEO and content tools | Sometimes | Share of licences used for content work |
| Distribution | Yes | Paid promotion, newsletter tools, outreach time |
| Refreshes | Yes | Budget 20 to 30 percent of the original cost per year |
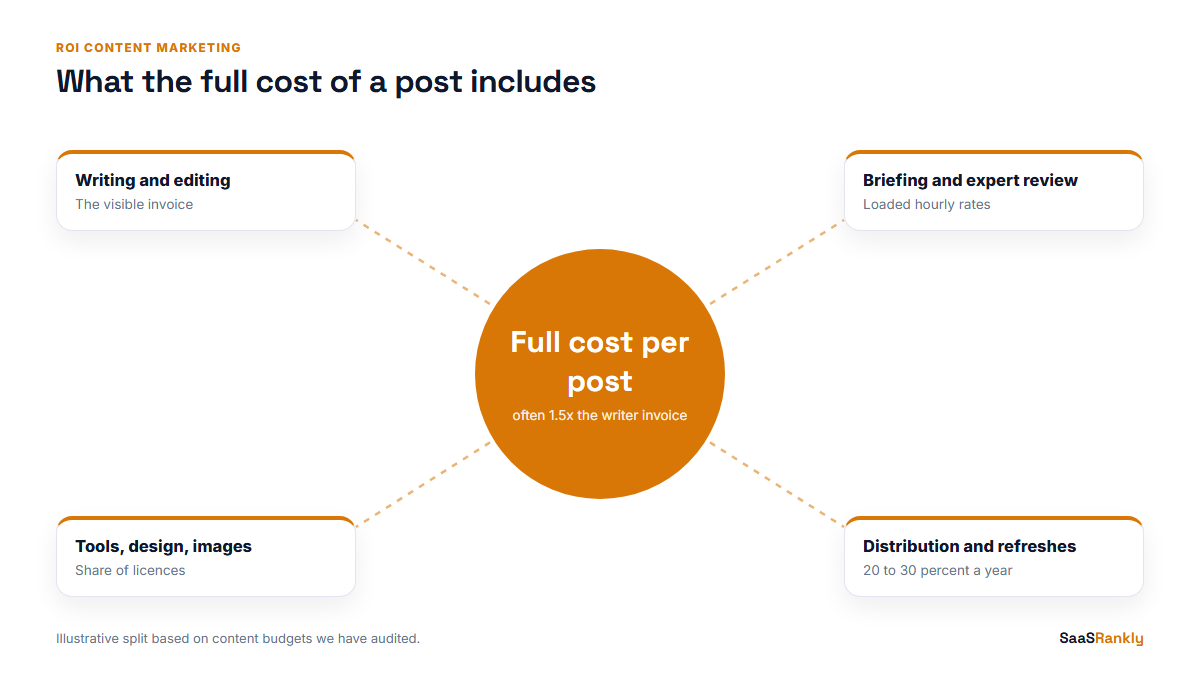
The subject matter expert line is the one that shocks founders. If your lead engineer spends two hours reviewing each technical post and their loaded cost is $120 an hour, that is $240 a post before a single word is edited. It is usually worth it, because expert review is what separates content that ranks from content that exists. It still belongs on the cost sheet.
Step 2: pick an attribution model you can defend
Attribution decides how much revenue content gets credited with, so it decides your ROI content marketing number more than anything else. Here is how the common models treat content, and the trap in each.
Myth: last click is the honest model because it is simple. Fact: last click hands almost all credit to branded search and direct visits, which are often the result of content someone read weeks earlier. Under last click, most blog programmes look like a loss.
Myth: first click proves content works. Fact: first click flatters content in the opposite direction. It credits the blog post a prospect skimmed a year ago for a deal a salesperson worked hard to close.
Myth: data-driven attribution in GA4 settles it. Fact: it is better than either extreme, but it only sees what GA4 sees. Long B2B cycles, multiple devices and consent banners leave gaps. Treat it as one input, not the verdict.
Our preference for SaaS is a simple position-based split you can explain in one sentence: 40 percent to the first touch, 40 percent to the touch before signup, 20 percent spread across the middle. Then add a self-reported “how did you hear about us” field on signup and compare. When the two methods broadly agree, you can trust the number. Our guide to measuring SaaS SEO in GA4 and Search Console shows how to set up the tracking side.
Step 3: choose the window and the margin
Measure over at least 12 months, and report a rolling 24 month view once you have the history. Content compounds, so a post published in January keeps earning long after the invoice is paid.
Use gross margin, not revenue, if your finance team will ask. SaaS gross margins usually sit between 70 and 85 percent, so the difference is not huge, but using margin stops the “you are counting revenue we have to pay to deliver” objection before it starts. For subscription revenue, count the first 12 months of the customer’s contract value, not lifetime value. LTV is a forecast, and forecasts inflate ROI.
A worked example: one year of a SaaS blog
Here is an illustrative example. “Ledgerly” is a made-up invoicing SaaS that published 48 posts in a year. The numbers are invented to show the method, but they sit inside the ranges we see on real audits.
| Line | Amount | Note |
|---|---|---|
| Writers and editing | $28,800 | 48 posts at $600 |
| Briefing, review, expert time | $14,400 | 5 hours per post at $60 loaded |
| Tools and images | $4,800 | Share of SEO tool and design licences |
| Distribution and refreshes | $6,000 | Newsletter, outreach, 8 refreshes |
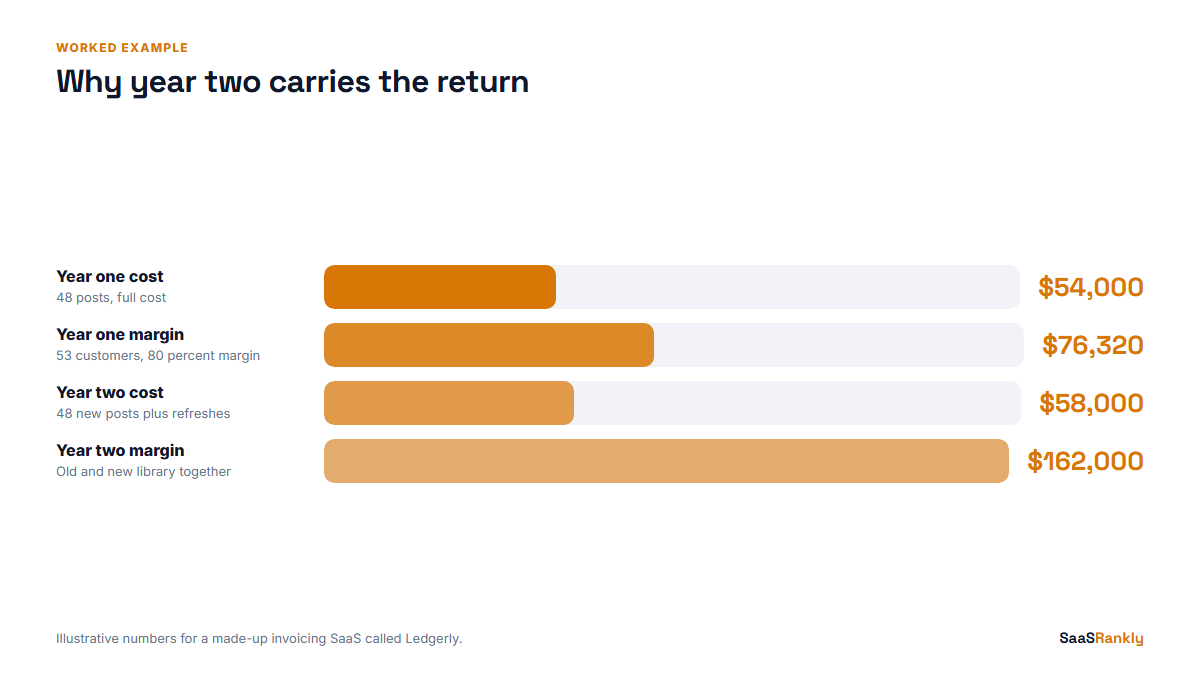
| Total cost | $54,000 | |
| Trials credited to content (position-based) | 410 | From 61,000 organic sessions to the blog |
| Paid customers from those trials | 53 | 13 percent trial to paid |
| First year contract value | $95,400 | 53 customers at $150 a month |
| Gross margin at 80 percent | $76,320 | |
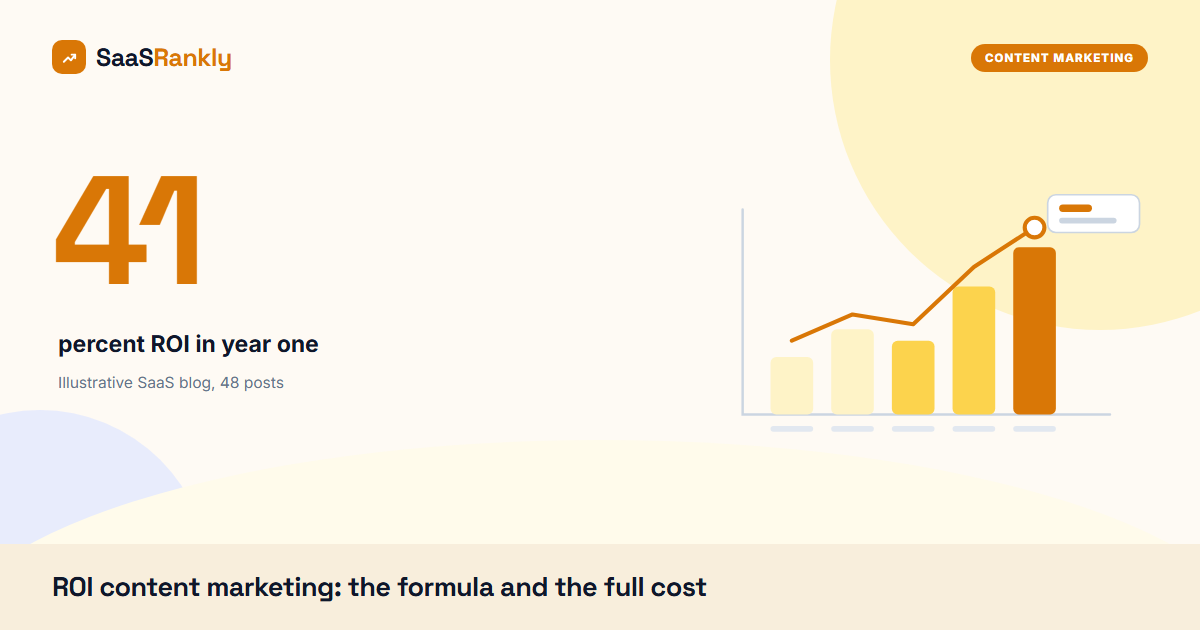
| Year one ROI | 41 percent | ($76,320 minus $54,000) divided by $54,000 |
Forty-one percent in year one looks modest. Now look at year two. Ledgerly keeps spending on new posts, but the first year’s 48 posts keep pulling traffic at close to zero extra cost, apart from refreshes. On audits like this we typically see year two ROI land somewhere between 150 and 300 percent, because last year’s library is still working. That compounding is the whole ROI content marketing case, and it is why cutting a programme after six months is the most expensive decision in content marketing.
What moves ROI content marketing numbers the most
When we look at why one SaaS content programme returns 3x and another barely breaks even, the same few levers come up. In order of impact:
- Topic choice. Posts that answer buyer questions (“X vs Y”, “best tool for Z”, pricing questions) convert at several times the rate of top-of-funnel explainers. A mixed calendar is fine, but the money comes from the bottom. Our post on the B2B content marketing funnel covers the split we use.
- Refreshing winners. Updating a post that already ranks on page two is often ten times cheaper per extra visit than writing a new one.
- Internal links to money pages. A blog that never links to pricing, demo or feature pages leaks the traffic it earns.
- Cutting the long tail of zero-traffic posts. Merge or redirect them. They cost upkeep and dilute the site.
- Cost per post. This matters less than people think. A $1,200 post that ranks beats three $300 posts that do not.
A monthly ROI content marketing checklist
Keep it short enough that someone actually runs it. We use this list on the first Monday of each month:
- Update the cost sheet with last month’s invoices and hours.
- Pull organic sessions and trials by landing page from GA4.
- Check Search Console for posts that moved into positions 5 to 15. Those are refresh candidates.
- Compare attributed trials with the self-reported source field.
- Recalculate rolling 12 month ROI and note the direction, not just the number.
- Flag posts with zero clicks for six months for a merge or redirect decision.
If you want the broader context of which numbers to put in front of leadership, our list of SEO KPIs and the post on SEO ROI for SaaS cover the reporting side. For the planning side, content SEO explains the brief, draft and refresh loop that keeps cost per post in check.
Quick recap: roi content marketing
- ROI equals content-driven gross margin minus content cost, divided by content cost.
- Agree on costs, attribution and time window with finance before you measure.
- Count people time: briefing, review and subject matter experts, not just writer invoices.
- Use a position-based split and check it against a self-reported source field.
- Measure over 12 months at least. Year two usually carries most of the return.
- Topic choice and refreshes move ROI far more than cutting cost per post.
FAQ
What is a good ROI for content marketing?
For a SaaS blog, breaking even in year one and reaching 150 to 300 percent in year two is a healthy pattern in our experience. A programme still below zero after 18 months usually has a topic or conversion problem, not a volume problem.
How do you calculate content marketing ROI?
Take the gross margin from customers you can credit to content, subtract the full cost of producing and promoting it, and divide by that cost. The hard part is the crediting, so agree on an attribution model first.
How long does content marketing take to show ROI?
Expect 6 to 12 months before a new post earns meaningful traffic, and 12 to 24 months before a programme shows a clear return. Established domains move faster than new ones.
Should I use revenue or lifetime value?
Use first year contract value, ideally at gross margin. Lifetime value depends on churn forecasts that can be argued forever, and it makes ROI content marketing reports look better than cash in the bank.
Which attribution model is best for content?
No model is perfect. A position-based split, checked against a “how did you hear about us” field on signup, gives a number most finance teams accept. Avoid pure last click for content, because it hides almost all of its effect.
What costs do teams forget in content ROI?
Briefing and review time, subject matter expert hours, distribution, and yearly refreshes. Together these often add 40 to 60 percent on top of writer invoices.