What happened: Google Analytics dashboards are now live for GA4 properties. Google added the launch to its Analytics “What’s new” page under September 9, 2026, and Search Engine Roundtable reported it on September 11. Google calls dashboards “a highly flexible way to help businesses view their KPIs on a single report,” built with drag-and-drop charts on a grid canvas. You create one from Reports, click “+ Create,” choose Dashboard, drop charts and fields onto the canvas, then Save and Publish to add it to the left navigation.
Source(s): Google Analytics “What’s new” entry, Google’s dashboards help article, and Search Engine Roundtable’s report.
Why Google Analytics dashboards matter for SaaS SEO teams
Ask most SaaS SEO leads where organic reporting lives and you get three answers. Signups and trials sit in GA4. Queries and clicks sit in Search Console. The page leadership actually looks at is a Looker Studio report that glues both together and breaks every few weeks when the GA4 connector hits its quota. GA4 itself never had a clean one-page view you could send a founder without a walkthrough. Explorations are built for analysts, and editing the report Library changes navigation for everyone.
Google Analytics dashboards close part of that gap. You can now put organic sessions, signups, the landing pages that convert and a signup funnel on one native page, with no connector in between. For a small team that only needs a weekly organic health check, that may be enough to retire a fragile Looker Studio file.
It is not a full reporting stack, though. The first version has hard limits, and a couple of them hit SEO use cases directly. We also have not confirmed whether the Search Console link fields can be placed on dashboard cards, so test that in your own property before you plan around it.
Google Analytics dashboards: the limits that shape what you build
| Item | What Google says | What it means for SEO reporting |
|---|---|---|
| Who can build | Editor or Administrator role needed to create and publish | Content marketers with Viewer access can read dashboards but cannot change them |
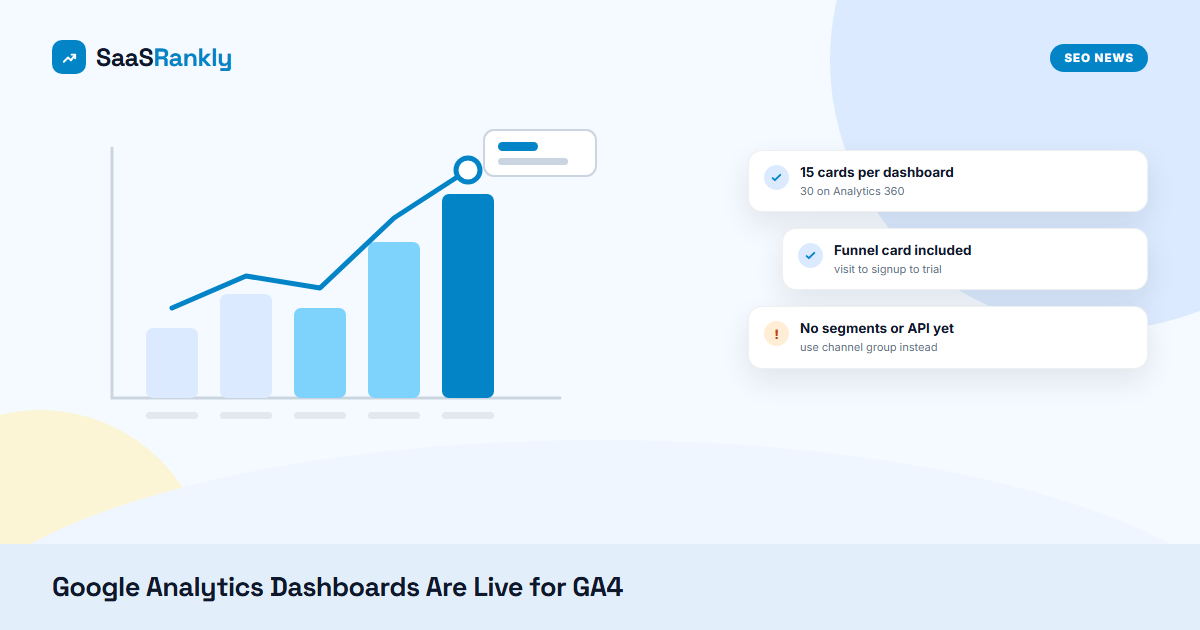
| Size | 15 cards on standard properties, 30 on Analytics 360 | Pick KPIs hard. One dashboard per audience beats one giant page |
| Sharing | All published dashboards are shared with the property | Everyone with access sees what you publish, so name them clearly |
| Chart types | Scorecard, table, line, bar (horizontal or vertical), donut, funnel | The funnel card finally shows organic visit to signup to trial on one page |
| Not supported yet | API support, segments, card-level comparisons | No “organic vs paid” segment compare on a card, and no pulling dashboard data into a warehouse |
The missing segments are the one that stings. Most organic reporting starts with “filter to organic search,” so you will lean on the default channel group as a dimension inside tables and bar charts rather than a segment applied to the whole card.
What to do with Google Analytics dashboards this week
- Build one organic dashboard inside the 15-card cap. Start with scorecards for sessions, key events (signup, trial start) and conversion rate, a line chart of sessions by default channel group, a table of landing pages sorted by key events, and a funnel card from landing page to signup to trial. Our SEO KPIs guide covers which numbers deserve a card and which are vanity.
- Check your key events first. A dashboard only repeats whatever tracking you already have. If trial starts are not marked as key events, the funnel card will be empty. The setup in measuring SaaS SEO with GA4 and GSC takes about an hour.
- Keep Looker Studio for blended reporting. Anything that mixes Search Console queries, CRM pipeline and GA4 still belongs in your SaaS SEO reporting dashboard. Use the native dashboard as the quick daily view and Looker Studio for the monthly board deck.
- Decide who publishes. Since published dashboards are visible to the whole property, limit publishing to one or two editors and prefix names like “SEO – Weekly.” With no API, export the numbers you need to keep, the same lesson from the missing June indexing data this week.
Quick recap: Google Analytics dashboards
- Google Analytics dashboards launched on September 9, 2026, and were reported on September 11.
- You build Google Analytics dashboards from Reports, then “+ Create,” then Dashboard, and Publish them to the left navigation.
- Standard properties get 15 cards per dashboard, and Analytics 360 gets 30.
- Google Analytics dashboards support scorecards, tables, line, bar, donut and funnel charts.
- Segments, card-level comparisons and API access are not supported in Google Analytics dashboards yet.
- For SaaS SEO, use a GA4 dashboard for the daily organic view and keep blended Search Console reporting in Looker Studio.